Claims
A term is defined before the claim that first uses it, and what supports a claim stands under its statement.
What sMAPE measures
Terms this claim uses
- sMAPE
- Symmetric mean absolute percentage error of a point forecast over a test set of actuals : , where a term with counts as 0. Introduced as the symmetric MAPE by Makridakis (1993), whose denominator had no absolute values; for positive actuals and forecasts the two agree.
- sMAPE term
- The contribution of one actual and one point forecast to sMAPE: , between 0 and 1, with when (including , where the fraction is ).
Claim C1. sMAPE depends only on the ratio of actual to forecast
Only the ratio of the actual to the forecast matters to sMAPE, not their size.
For and , the sMAPE term depends on and only through their ratio : .
Proof 3 steps
- Since and are positive, . So .
- Dividing the numerator and the denominator by gives . Since , . And .
So . The contribution depends only on the ratio of actual to forecast. ∎
Its formulae were also checked on numbers: E1 in the record.
Earlier work and other claims
- Extends Tofallis (2015). Tofallis (2015) lists the sMAPE term, |y-f|/[(|y|+|f|)/2], among Tornqvist et al.'s measures of relative change; claim C1 shows it depends on the actual and the forecast only through their ratio.
Proved · checked independently by an AI agent · confirmed by Ivan Svetunkov · tested as plannedRecord
- Claim
- C1 · formal · principal · extends earlier work
- Plan
- Test planned in lab plan PL9, recorded 17 November 2026
- Evidence
- E18, E1 in the record
- Check: confirmed
- By an AI agent (proof checking), full. Derived from the statement alone (first wording, with the factor 200), then compared with the final proofs.md (paper H1), which agrees after rescaling. No conditions needed.
- Check: confirmed
- By Ivan Svetunkov, full. The supervisor read the proof of paper H1 in proofs.md (AR1.R2; rendered as AR2.R2) and confirmed it: first "Confirmed" (DC6), then, after the last corrections of paper H4, H5 and H9, "All looks fine now. NExt".
- Support score
- SupportS 100 of 100. The score checks the record, not the science.
- Record
- This claim on the record page
- To cite it
- The page of this claim
Claim C2. Too high and too low by the same factor score the same
A forecast twice too high and one half too low score the same. For equal absolute errors the higher one scores better. This compares forecasts for one known actual. Which forecast is best when the actual is uncertain is claim claim C4: sMAPE does not in general reward forecasting too high.
For and :
- (a)Replacing by leaves the sMAPE term unchanged, so a forecast times too high () and one times too low () score the same
- (b)Of two forecasts the same absolute distance from (), the higher one scores better:
Proof 4 steps
- By claim C1, . Replacing by gives . Multiplying the numerator and the denominator by gives , the same value.
- The forecast has , and has . By step 1 they score the same. This is (a).
- The forecasts and are both away from , so both numerators are . The denominators are and . The larger denominator gives the smaller value. This is (b).
So sMAPE treats a forecast times too high and one times too low alike. It favours the high forecast only when the two are equally wrong in absolute terms. ∎
Its formulae were also checked on numbers: E1 in the record.
Elsewhere in this paper
Earlier work and other claims
- Qualifies Svetunkov (2026a), C33. C33 says sMAPE penalises a forecast below the outcome more than one above it. That holds for two forecasts the same absolute distance away (claim C2 b); a forecast k times too low and one k times too high score the same (claim C2 a).
- Refines Goodwin and Lawton (1999). Goodwin and Lawton (1999) showed that sMAPE is asymmetric: for the same absolute error it scores a forecast above the actual better than one below. Claim C2 proves this (b) and shows that by ratio sMAPE is symmetric (a).
- Refines Hyndman and Koehler (2006). Hyndman and Koehler (2006) note that for the same actual sMAPE penalises low forecasts more heavily than high ones; claim C2 shows this holds for equal absolute errors and not for equal ratios.
- Refines Hewamalage et al. (2023). Hewamalage et al. (2023) note that sMAPE penalises underestimates more than overestimates for the same actual; claim C2 shows this holds for equal absolute errors and not for equal ratios.
- Refines Chen et al. (2017). Chen et al. (2017) show a heavier penalty on a forecast 10% under the actual than on one 10% over; claim C2 shows that forecasts the same factor too high and too low score the same.
Proved · checked independently by an AI agent · confirmed by Ivan Svetunkov · tested as plannedRecord
- Claim
- C2 · formal · secondary · no earlier result found
- Plan
- Test planned in lab plan PL9, recorded 17 November 2026
- Evidence
- E19, E1 in the record
- Check: confirmed
- By an AI agent (proof checking), full. Derived from the statement alone (earlier wording: old H2 and H10), then compared with the final proofs.md (paper H2), which agrees. No conditions needed.
- Check: confirmed
- By Ivan Svetunkov, full. The supervisor read the proof of paper H2 in proofs.md (AR1.R2; rendered as AR2.R2) and confirmed it: first "Confirmed" (DC6), then, after the last corrections of paper H4, H5 and H9, "All looks fine now. NExt".
- Support score
- SupportS 100 of 100. The score checks the record, not the science.
- Record
- This claim on the record page
Terms this claim uses
- log error
- For a positive actual and a positive forecast , .
- log-MAE
- 100 times the mean absolute error of as a forecast of : . Unbounded; sMAPE's small-error limit (claim C3); minimised by the median.
Claim C3. sMAPE is a hyperbolic tangent of the log error
sMAPE measures the error on the log scale. For small errors it is half the absolute log error; for large errors it levels off. For small errors its best forecast is close to the median, but not in general the median.
For and , the sMAPE term is (log error ).
- (a)It is 0 when , strictly increasing and concave in , and bounded by 1, which it approaches as grows.
- (b); so when all log errors are small, sMAPE is about 100 times the mean absolute error of as a forecast of (log-MAE).
- (c)The log-MAE of a test set is minimised by its median; sMAPE is then minimised near the median, not in general at it. For positive actuals with a median , a forecast that minimises their sMAPE satisfies its mean absolute log error exceeds the smallest possible by at most a twelfth of its mean cubed absolute log error. The minimiser is the median itself only under further conditions on the distribution of the actuals.
Proof 9 steps
- Write , so that . By claim C1, .
- Multiplying the numerator and the denominator of by gives . The denominator is positive, so .
- changes only its sign when its argument changes sign: , as the definition shows. So , which is the stated form.
- For (a): is 0 at 0. On it is strictly increasing and concave, and it approaches 1 as its argument grows; its derivative is positive and decreasing for . With the argument , has these properties in .
- For (b): for every , . The upper bound holds because has slope at most 1; the lower one because the derivative of is , and the difference is 0 at . Putting gives the bounds.
- For (c), the median: the mean of over a test set is minimised when is a median of the . Since the logarithm is increasing, this is when is a median of the .
- For (c), the bound: with the log errors of the test set, write , and for the mean of the sMAPE terms of the test set. Averaging the bounds of step 5 over the test set gives for every . Let minimise , so that . Then Multiplying by 2 gives , the stated inequality.
- For (c), not the median in general: take the five actuals , whose median is . With the forecast at the log errors are in size and the sMAPE terms sum to . With the forecast at 1 the log errors are and the terms sum to , which is lower. So the median does not minimise the sMAPE of this test set, although it minimises its log-MAE (step 6).
So . It rises from 0 like half the absolute log error and levels off at 1. For small errors sMAPE is close to the log-MAE, and its minimiser is close to the median without in general being the median. ∎
Its formulae were also checked on numbers: E31 in the record.
Earlier work and other claims
- Extends Tofallis (2015). Tofallis (2015) relates sMAPE to the log accuracy ratio among relative measures; claim C3 shows the sMAPE term is exactly the hyperbolic tangent of half the absolute log ratio.
Proved · checked independently by an AI agent · confirmed by Ivan Svetunkov · checked independently by an AI agent · tested as plannedRecord
- Claim
- C3 · formal · principal · extends earlier work
- Plan
- Test planned in lab plan PL12, recorded 18 November 2026
- Evidence
- E20, E31 in the record
- Check: confirmed
- By an AI agent (proof checking), full. Derived from the statement alone (earlier wording: old H3 and H9), then compared with the final proofs.md (paper H3), which agrees; the bound in (b) follows from x - x^3/3 <= tanh x <= x. Concavity is in the absolute log error on [0, inf); 'minimised by the median' is the small-error approximation, as stated.
- Check: confirmed
- By Ivan Svetunkov, full. The supervisor read the proof of paper H3 in proofs.md (AR1.R2; rendered as AR2.R2) and confirmed it: first "Confirmed" (DC6), then, after the last corrections of paper H4, H5 and H9, "All looks fine now. NExt".
- Check: confirmed
- By an AI agent (proof checking, version 3), full. Derived independently. With $z=\ln y-\ln f$, $s=|e^z-1|/(e^z+1)=\tanh(|z|/2)$. (a) $\tanh(u/2)$ on $u\ge0$ is 0 at 0, strictly increasing, concave (derivative $\tfrac12\operatorname{sech}^2(u/2)$ positive and decreasing), below 1 with limit 1. (b) $x-x^3/3\le\tanh x\le x$ for $x\ge0$ (the lower bound: $\frac{d}{dx}(\tanh x-x+x^3/3)=x^2-\tanh^2x\ge0$); with $x=|z|/2$ this gives $0\le|z|/2-s\le|z|^3/24$, so $200\cdot\mathrm{mean}(s)\approx100\cdot\mathrm{mean}|z|$. (c) Averaging (b): $\bar s\le a/2\le\bar s+k/24$; with $\bar s(f^*)\le\bar s(m)$, $a(f^*)/2\le\bar s(f^*)+k(f^*)/24\le\bar s(m)+k(f^*)/24\le a(m)/2+k(f^*)/24$, which is the stated bound; the log-MAE is minimised at any median of the $\ln y_t$, i.e. at any median $m$. The proof (proofs.md H3) does exactly this; its only unproved step is the elementary inequality $x-x^3/3\le\tanh x$, closed by the derivative argument above. I recomputed the counterexample of step 8 (actuals $1,1,e,e^4,e^4$: sums 2.734 at the median $e$ against 2.390 at 1), which supports "not in general at it". Every part holds as worded.
- Support score
- SupportS 100 of 100. The score checks the record, not the science.
- Record
- This claim on the record page
- To cite it
- The page of this claim
What sMAPE rewards for positive actuals
Term this claim uses
- expected sMAPE
- The expected sMAPE of a fixed forecast under the distribution of the actual : , where is the expectation over the random actual . Computed from the distribution (by integration or exact sums), never from a sample.
Claim C9. Expected sMAPE is always finite and has a minimiser
The expected sMAPE of a forecast is always finite, even when the actuals have a heavy tail that makes the expected RMSE, MAE or MAPE infinite. And there is always a best forecast.
For actuals and forecasts of any sign, . So the expected sMAPE of every forecast is finite, between 0 and 200, whatever the distribution of the actuals and without any moment of it being finite (unlike RMSE, MAE and MAPE, claim C8). For a positive random actual , at least one forecast has the lowest expected sMAPE.
Proof 3 steps
- Finite. For positive values, (claim C3), which lies between 0 and 1. For any signs, , so again . A quantity between 0 and 1 has an expectation between 0 and 1, so the expected sMAPE is between 0 and 200, whatever the actuals.
- A best forecast. Write for the expectation over the random actual . As approaches 0 or grows without bound, grows for every positive value of , so approaches 1 (claim C3), and so does its expectation. For every positive it is below 1. It changes continuously with , because does and is at most 1 (bounded convergence). A continuous function that is below 1 in between and returns towards 1 at both ends reaches a lowest value at some . A forecast of 0 or a negative forecast scores 1 on every positive actual, so it is never better.
So the expected sMAPE is always finite, whatever the tails of the actuals. For positive actuals, a forecast with the lowest expected sMAPE always exists. ∎
Its formulae were also checked on numbers: E1 in the record.
Earlier work and other claims
- Extends Hewamalage et al. (2023). Hewamalage et al. (2023) note that sMAPE is bounded by 200; claim C9 adds that its expected value is therefore finite for every distribution and that a best forecast exists.
Proved · checked independently by an AI agent · confirmed by Ivan Svetunkov · tested as plannedRecord
- Claim
- C9 · formal · principal · extends earlier work
- Plan
- Test planned in lab plan PL9, recorded 17 November 2026
- Evidence
- E21, E1 in the record
- Check: confirmed
- By an AI agent (proof checking), full. Derived from the statement alone (triangle inequality; bounded convergence gives continuity in f and the limit 1 at both ends, below 1 between), then compared with the final proofs.md (paper H4), which agrees. No condition on the distribution is needed.
- Check: confirmed
- By Ivan Svetunkov, full. The supervisor read the proof of paper H4 in proofs.md (AR1.R2; rendered as AR2.R2) and confirmed it: first "Confirmed" (DC6), then, after the last corrections of paper H4, H5 and H9, "All looks fine now. NExt".
- Support score
- SupportS 100 of 100. The score checks the record, not the science.
- Record
- This claim on the record page
- To cite it
- The page of this claim
Terms this claim uses
- weight
- For a positive actual and a positive forecast , : how much the actual pulls the forecast that minimises expected sMAPE, since the derivative of in is . Largest at , the same for and .
- sMAPE target
- The value or values of that minimise expected sMAPE for a given distribution of the actual , : the functional sMAPE rewards. It may be a single value or several.
Claim C4. sMAPE targets a weighted median
For any distribution, the forecast sMAPE rewards balances the actuals below it and above it. Each actual is weighted by how close it is to the forecast by ratio.
Let the actual be positive and take no single value with positive probability. A forecast has the lowest expected sMAPE only if the actuals below and those above it carry equal total weight : So the sMAPE target is a median of the actuals weighted by , where the ordinary median gives every actual the same weight. An actual's weight is largest when it equals the forecast, is the same for and , and falls as moves away from 1 in either direction.
Proof 6 steps
- The derivative of . When , . By the quotient rule its derivative in is . When , , and in the same way its derivative is . Together: for , the derivative is .
- A bound on it. Since , . So the derivative of is at most in size, whatever , and at most for every forecast above . The only actual at which has no derivative is , which has probability zero.
- The derivative of the expectation. With this bound, the derivative may be taken inside the expectation (dominated convergence):
- The balance. A forecast with the lowest expected sMAPE exists (claim C9). There this derivative is 0, which is the stated balance: half the total weight lies below and half above.
- The weight. With , . The sum is the same for and . It is smallest, 2, at , and grows as moves away from 1. So is largest at and falls as moves away from 1, equally for and .
So sMAPE targets a weighted median of the actuals. Each actual is weighted by how close it is to the forecast by ratio. ∎
Its formulae were also checked on numbers: E31 in the record.
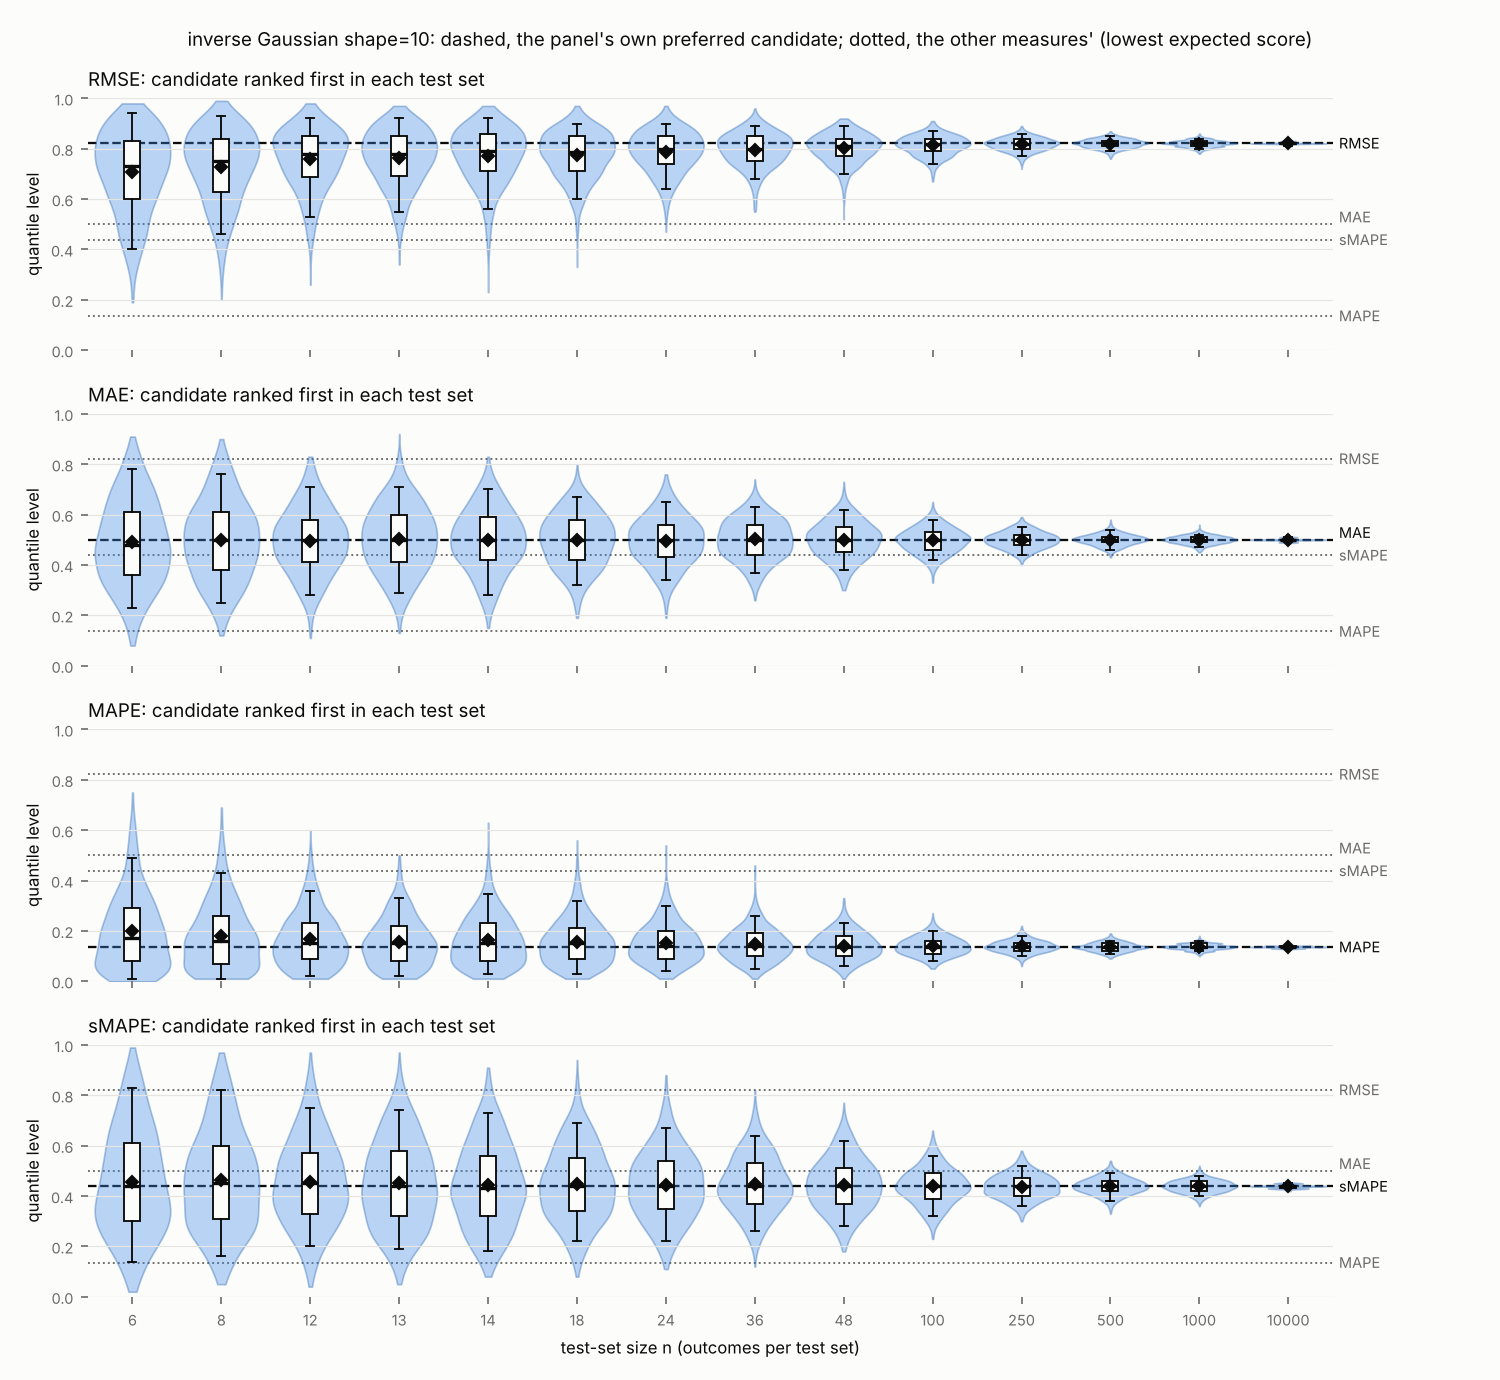
Supported by numerical check C13
Computed on 34 distributions, the target lies on the side of the median that carries more weight, as this claim and claim C12 prove.
Earlier work and other claims
- Explains Svetunkov (2026b), C5. C5 found sMAPE's preferred candidate close to the median on other distributions; claim C4 shows why: the target is a weighted median, on the side of the median that carries more weight (claim C12).
- Answers Tofallis (2015). Tofallis (2015) states that minimising sMAPE does not produce an established measure of location; claim C4 identifies the target as a median weighted by y/(y+f)^2.
- Qualifies Hewamalage et al. (2023). Hewamalage et al. (2023) say sMAPE may tend towards selecting a slightly overestimating model; claim C4 shows the target is a weighted median, which lies on the side of the median that carries more weight, above or below it (claim C12).
- Qualifies claim C2. Claim C2 compares two forecasts of one known actual. For an uncertain actual, the forecast sMAPE rewards is the weighted median of claim C4, not a forecast that is too high.
Proved · checked independently by an AI agent · confirmed by Ivan Svetunkov · checked independently by an AI agent · tested as plannedRecord
- Claim
- C4 · formal · principal · no earlier result found
- Plan
- Test planned in lab plan PL12, recorded 18 November 2026
- Evidence
- E22, E31 in the record
- Check: disputed
- By an AI agent (proof checking), full. Derived from the statement alone, then compared with the final proofs.md (paper H5). The balance, the weighted median, the properties of the weight and the 'above'/'below' cases hold. The last clause fails: equal weights at the median make it a stationary point, not necessarily the minimum, and proof step 7 does not show it. Counterexample (numerical): ln Y ~ 0.41408 N(-1.48848, 0.2^2) + 0.03 N(0, 0.3^2) + 0.55592 N(1.13795, 1) has median 1 and equal weights there, a flat inflection at the median, and a single local minimum at ln f = -1.36. Fix: drop 'at the median when the two weights are equal', or add 'if the median is a local minimum'. The statement was corrected, and the checker confirmed the corrected wording in a later check listed here.
- Check: confirmed
- By an AI agent (proof checking), full. Checked the corrected wording against my own derivation and the revised proofs.md (paper H5, new step 8). The clause disputed in CK5 now says that with equal weights the median is a flat point, the target only if it is a local minimum, and possibly a flat inflection; that is what holds, and my counterexample (single local minimum at ln f = -1.36, median at 1) is an instance. Needs Y positive with no atoms, as stated.
- Check: confirmed
- By an AI agent (proof checking), full. Checked the added sufficient condition against my own derivation and the revised proofs.md (paper H5, steps 8 to 10). The second derivative of the expected term in ln f is g(c) - E[sech^2 tanh]/2, as I derived independently; zero first derivative plus the stated strict inequality gives a strict local minimum at the median, which is the target when there is a single local minimum. The clause needs ln Y to have a density continuous at ln m, as stated; my counterexample sits at equality, consistent with it.
- Check: confirmed
- By Ivan Svetunkov, full. The supervisor read the proof of paper H5 in proofs.md (AR1.R2; rendered as AR2.R2) and confirmed it: first "Confirmed" (DC6), then, after the last corrections of paper H4, H5 and H9, "All looks fine now. NExt".
- Check: confirmed
- By an AI agent (proof checking, version 3), full. Derived independently. For $y\ne f$, $\partial_f s(y,f)=2w(y,f)(\mathbf 1\{y<f\}-\mathbf 1\{y>f\})$ with $w=y/(y+f)^2\le1/(4f)$; since $P(Y=f)=0$ and the difference quotients are bounded by $1/(2(f-\epsilon))$ near $f$, dominated convergence gives $\frac{d}{df}\mathrm E[s(Y,f)]=2\mathrm E[w(\mathbf 1\{Y<f\}-\mathbf 1\{Y>f\})]$ at every $f>0$, so a minimiser (necessarily $f>0$: $f\le0$ scores 1 on every positive actual while $\mathrm E[s]<1$ for $f>0$) satisfies the stated balance. With $r=y/f$, $w=\frac1f\,r/(1+r)^2=\frac1f/(r+2+1/r)$: symmetric under $r\to1/r$, largest at $r=1$, decreasing as $r$ moves away from 1 on either side. The proof (proofs.md H5) matches step by step; the local uniformity of the dominating bound in $f$ is left implicit but is immediate as above. Its use of H4 (existence) is not needed for the "only if" statement but is harmless. Every part holds as worded.
- Support score
- SupportS 100 of 100. The score checks the record, not the science.
- Record
- This claim on the record page
- To cite it
- The page of this claim
Claim C5. Symmetric, unimodal logs: the target is the median
When the logarithm of the actual is symmetric with a single peak, the weights balance at the median, and the median is the forecast sMAPE rewards. Lognormal and log-Laplace actuals are examples.
Let have a density symmetric about , , and unimodal: whenever , strictly on a set of positive probability. Then the median of is the only sMAPE target.
Proof 6 steps
- By claim C3, . Take a forecast with ; the case is the mirror image. We show that its expected sMAPE is larger than that of .
- Write both expectations as integrals over , the distance of from . For the forecast , ; for , . Their difference is
- Write . By the symmetry of about , . So reflecting about reverses the sign of .
- Split the integral at and reflect its left part onto the right. This gives
- For , is closer to 0 than is: . So the bracket is negative, because is increasing (claim C3). And by unimodality: . Their product is , and on a set of positive probability. So .
So every forecast other than the median has a larger expected sMAPE. The median is the only forecast that minimises it. ∎
Its formulae were also checked on numbers: E1 in the record.
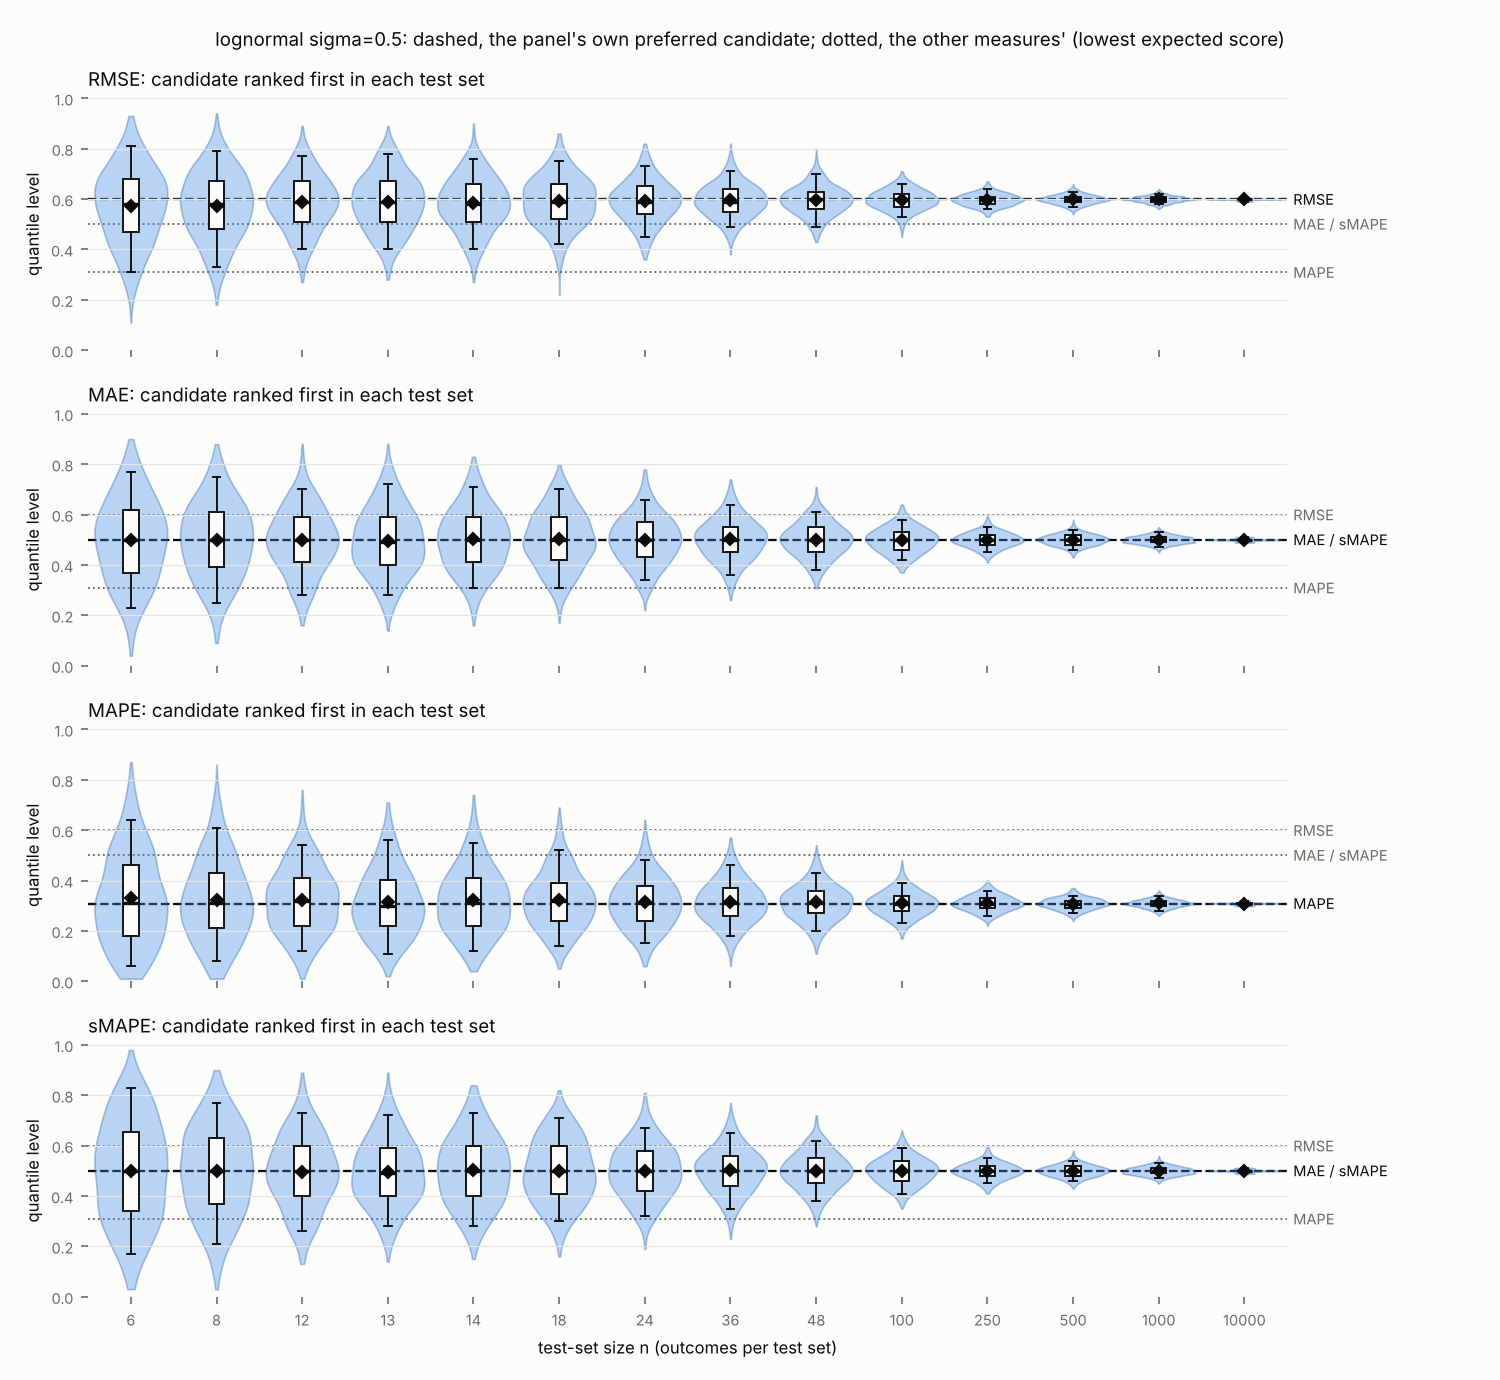
Supported by numerical check C13
Computed on lognormal outcomes, the target is the median, as this claim proves.
Earlier work and other claims
- Repeats Anderson (1955). Claim C5 is an elementary case of Anderson's theorem on symmetric unimodal densities, proved here directly for the expected sMAPE.
Proved · checked independently by an AI agent · confirmed by Ivan Svetunkov · tested as plannedRecord
- Claim
- C5 · formal · supporting · repeats an earlier result
- Plan
- Test planned in lab plan PL9, recorded 17 November 2026
- Evidence
- E23, E1 in the record
- Check: confirmed
- By an AI agent (proof checking), full. Derived from the statement alone (sign of the derivative of expected sMAPE in ln f), then compared with the final proofs.md (paper H6), which reaches it by reflecting about -t/2; both hold under the unimodality as now defined in the statement.
- Check: confirmed
- By Ivan Svetunkov, full. The supervisor read the proof of paper H6 in proofs.md (AR1.R2; rendered as AR2.R2) and confirmed it: first "Confirmed" (DC6), then, after the last corrections of paper H4, H5 and H9, "All looks fine now. NExt".
- Support score
- SupportS 100 of 100. The score checks the record, not the science.
- Record
- This claim on the record page
Claim C12. When sMAPE targets the ordinary median
The forecast sMAPE rewards lies above the ordinary median when the actuals above it carry more weight, and below it when those below do. When the weights balance and enough actuals lie near the median, the median is rewarded.
Let the actual be positive and take no single value with positive probability, let be its ordinary (unweighted) median, and let its expected sMAPE have a single local minimum. With the forecast at , compare the total weight of the actuals above with that of the actuals below it.
- (a)If the actuals above carry more weight, the sMAPE target lies above ; if those below carry more, it lies below .
- (b)If the two weights are equal, is a point where expected sMAPE is flat. It is then the target if, in addition, where is the density of , continuous at : this makes a strict local minimum. Without it, can be a flat point of inflection, with the target elsewhere.
- (c)When has a density symmetric about and unimodal, is the only target; lognormal and log-Laplace actuals are examples.
Proof 8 steps
- The derivative at the median. By claim C4, step 3, the derivative of the expected sMAPE term in is . At it is twice the total weight of the actuals below minus that of the actuals above .
- The shape of expected sMAPE. With a single local minimum, the expected sMAPE decreases up to it and increases after it. Otherwise it would turn again, at a local maximum. After that turn it would have to fall and then rise once more, because it returns towards 1 at both ends (claim C9). That would give a second local minimum.
- (a). If the actuals above carry more weight, the derivative at the median is negative (step 1): the expected sMAPE is decreasing at the median. By step 2, the median then lies before the minimum, so the target is above the median. The case where the actuals below carry more weight is the mirror image.
- The second derivative. Measure the forecast on the log scale, , so that the expected contribution is (claim C3). The derivative of in is for and for : it jumps by 1 at . Differentiating again and taking the expectation over , the jumps add the density of at , and elsewhere the second derivative is . So the second derivative of the expected contribution is This holds when is continuous at : since , the first derivative is , whose derivative at is , plus the expectation of with the sign of , a function of with a bounded continuous derivative, which may be differentiated inside the expectation.
- (b), the sufficient condition. If the two weights are equal, the first derivative at the median is 0 (step 1): the expected sMAPE is flat there. If, in addition, the stated inequality holds, the second derivative at is positive (step 4), so the median is a strict local minimum. With a single local minimum, it is the target.
- (b), without the inequality. A point where the first derivative is 0 can be a flat point of inflection, through which the expected sMAPE keeps rising (or keeps falling) without turning. An example, built by the independent checker of this section: let be a mixture of three normal distributions, with mean and standard deviation (weight 0.406125), mean 0 and standard deviation (weight 0.054825), and mean and standard deviation 1 (weight 0.539050); these values are rounded from the exact solution of the three conditions. Its median is , the two weights are equal there, and the second derivative of step 4 is 0 at ; the expected sMAPE rises through , where it is flat, and its only minimum is near . So equal weights alone do not make the median the target.
- (c). By claim C5 the median is then the only forecast with the lowest expected sMAPE (a density cannot be constant, so a symmetric unimodal density is strictly lower somewhere away from its centre, as claim C5 asks). For lognormal actuals has a normal density, and for log-Laplace actuals the Laplace density ; both are symmetric about and strictly decreasing in the distance from it.
So the target is above the ordinary median when the actuals above it carry more of the weight, and below it when those below carry more. When the two balance, the median is the target if, in addition, enough actuals lie near it, as the stated inequality says; this is the case when the log of the actual is symmetric with a single peak. ∎
Its formulae were also checked on numbers: E31 in the record.
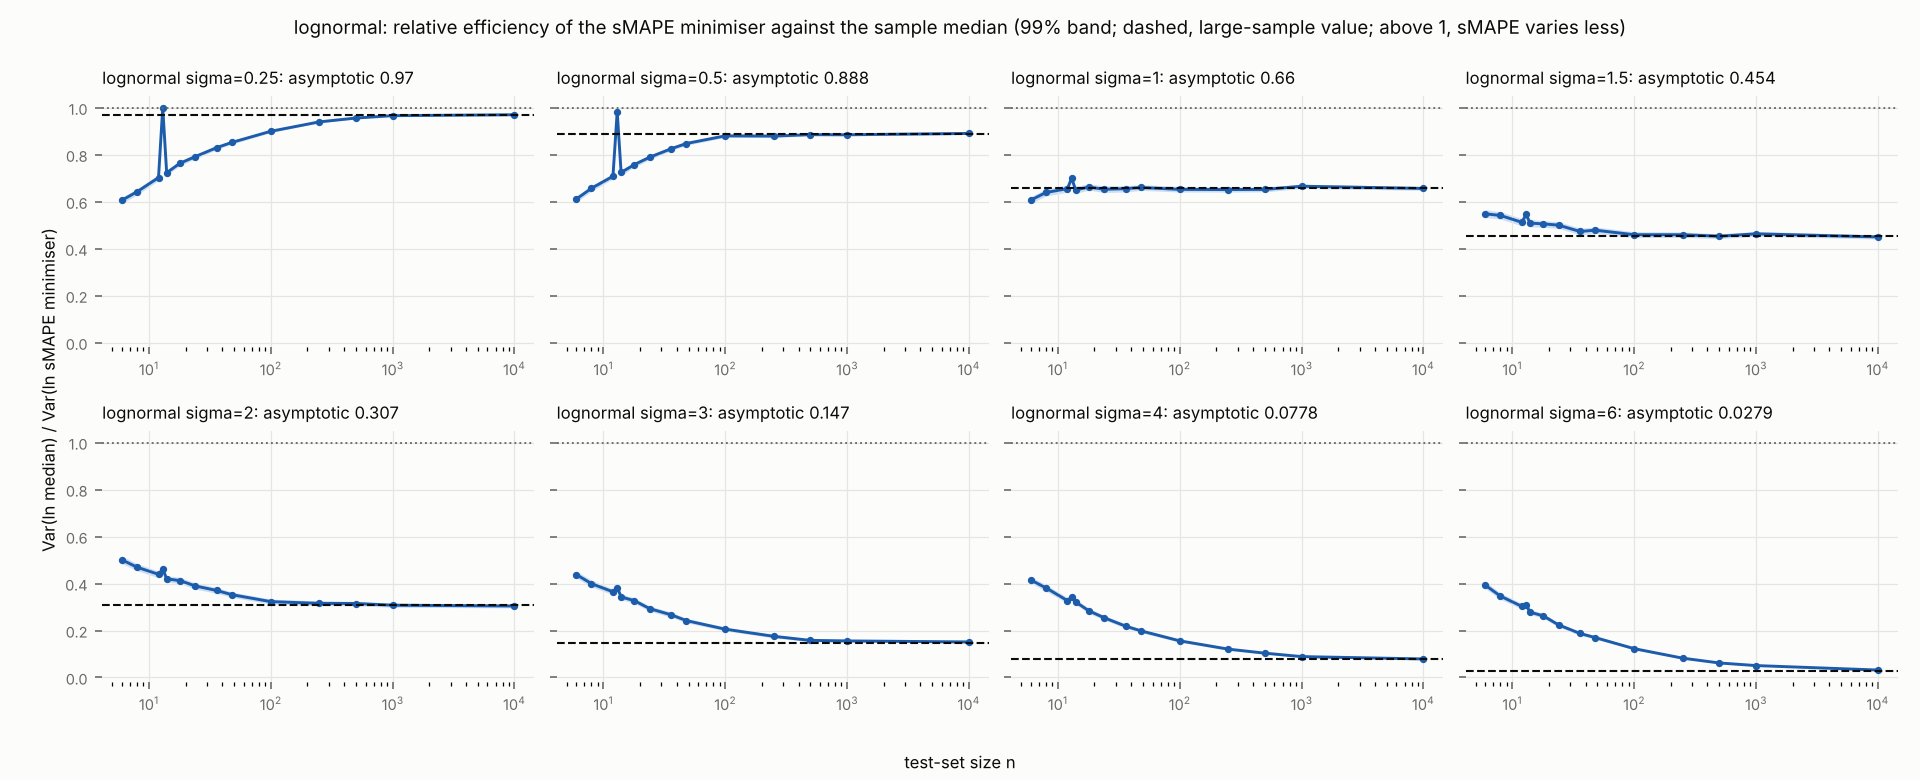
Qualified by claim C15
Where this claim makes the median the target, the forecast that minimises sMAPE on a test set finds it less precisely than the sample median.
Earlier work and other claims
- Explains Svetunkov (2026b), C5. C5 found by simulation that sMAPE prefers the median on lognormal and log-Laplace outcomes; claim C12 proves it for every symmetric unimodal ln y.
Proved · checked independently by an AI agent · checked independently by an AI agent · tested as plannedRecord
- Claim
- C12 · formal · principal · no earlier result found
- Plan
- Test planned in lab plan PL12, recorded 18 November 2026
- Evidence
- E29, E31 in the record
- Check: confirmed
- By an AI agent (proof checking), full. Checked against my own derivations of H5 and H4 and the proofs in proofs.md (paper H6; paper H5 steps 3, 6, 8, 9). (a) holds even with unimodality in the weak sense, since an integrable density cannot be symmetric about two points; (b) holds because a zero first derivative and a positive second derivative in ln f make the median a strict local minimum, which is the target when there is a single local minimum. Caveat: (b) is 'more general' than (a) only where the density in (a) is continuous at ln m.
- Check: confirmed
- By an AI agent (proof checking, version 3), full. Derived independently, on the log scale $\phi(t)=\mathrm E\tanh(|\ln Y-t|/2)$. (a) $\phi'(\ln m)$ has the sign of (weight below) minus (weight above). With a single local minimum, $\phi$ is decreasing before it and increasing after it: if it were not monotone on one side, a continuous function that is below 1 and tends to 1 at both ends would have an interior local maximum and then a second local minimum. So a negative derivative at $m$ puts the target above $m$, a positive one below. The proof's step 2 says this tersely but correctly. (b) Writing the kernel $-\operatorname{sign}(v)\operatorname{sech}^2(v/2)=-\operatorname{sign}(v)+\operatorname{sign}(v)\tanh^2(v/2)$, the first part gives $\tfrac12(2G(t)-1)$, which is differentiable at $t$ with derivative $g(t)$ when $g$ is continuous at $t$, and the second has a bounded continuous derivative. So $\phi''(\ln m)=g(\ln m)-\tfrac12\mathrm E[\operatorname{sech}^2(x/2)\tanh(|x|/2)]$ exists under continuity of $g$ at $\ln m$ alone. With $\phi'(\ln m)=0$ and $\phi''(\ln m)>0$, $m$ is a strict local minimum, hence the target. This agrees with H12 step 4, which interchanges derivative and expectation without justification; the decomposition above closes that gap. The existence claim "Without it, $m$ can be a flat point of inflection, with the target elsewhere" is supported in the proof only by a reference to an example built by an earlier checker that is not given. I built one myself: $\ln Y-\ln m\sim0.4061\,N(-1.5,0.3^2)+0.0548\,N(0,0.5^2)+0.5390\,N(1.1587,1)$ has median 0, $\phi'(0)=\phi''(0)=0$, $\phi'\ge0$ on both sides of 0 (a flat inflection) and a single local minimum near $t=-1.25$ (numerical grid). Including such an explicit example in the proof would make step 6 self-contained. (Under the single-minimum hypothesis a failing inequality can only mean equality, $\phi''=0$; a strict local maximum is impossible, so "flat point of inflection" is the right description.) (c) holds via H6. Note that H6 assumes unimodality "strictly on a set of positive probability", which H38 (c) does not state; the conclusion holds for every symmetric, weakly unimodal density anyway: $P(|X-t|\le c)<P(|X|\le c)$ for $t\ne0$ on a set of $c$ of positive measure (otherwise $g$ would be constant on $(0,\infty)$), and $\tanh$ is strictly increasing, so no correction to the statement is needed. Lognormal and log-Laplace qualify. Every part holds as worded.
- Support score
- SupportS 100 of 100. The score checks the record, not the science.
- Record
- This claim on the record page
- To cite it
- The page of this claim
Claim C6. Two separate groups: the median is a local maximum
When the actuals form two separate groups, the median falls in the gap between them, far from both. So sMAPE scores it worse than forecasts near either group.
Let have two modes, at and (), with the actuals concentrated near them: a mixture of a distribution near and its mirror image about , with weights and .
- (a)With equal weights the median lies in the gap between the two groups; when the groups are narrow enough it has a higher expected sMAPE than forecasts near either mode, and it is a local maximum of expected sMAPE; there is a minimiser on each side of the median, and these approach and as the groups narrow.
- (b)With unequal weights and narrow groups, the best forecast is near the mode of the larger group.
Proof 11 steps
- Write forecasts on the log scale as . By claim C3, the expected contribution is , a function of .
- Why the median is bad. Take the groups to be single points first. A forecast at the median is away, on the log scale, from every actual. So its expected is .
- A forecast at the mode, , is exact for half the actuals and away from the other half. So its expected is . Since , this is . The mode is better.
- The expected changes continuously as the groups widen from points, because is bounded and continuous. So the mode is still better for narrow groups.
- Why the median is a local maximum. By claim C12, step 4, the second derivative of the expected contribution at the median is
- By symmetry the first derivative at the median is 0. When the groups narrow, few actuals lie near the median, so tends to 0. Meanwhile the expectation tends to . So the second derivative becomes negative, and the median is a local maximum.
- A minimiser on each side. The expected sMAPE has a lowest point (claim C9). It is not at the local maximum . By symmetry, if is a minimiser, so is .
- Near the modes. Write , with . The function is largest at 0 and falls as grows, more slowly the larger is. Minimising the expected is maximising . As the groups narrow, this approaches , uniformly in .
- With equal weights, take . The derivative of this limit is half the rate at which falls at distance , minus half the rate at distance . It is positive, because falls faster nearer 0. For the limit decreases. So on its only maximum is at , and the minimisers on that side approach . By symmetry, those on the other side approach . This proves (a).
- Unequal weights. The limit increases up to and decreases after . In between it is convex, by the argument of step 9. So its maximum is at or at . The difference between these two values is , which is positive when . So the maximum, and with it the best forecast for narrow groups, is at the mode of the larger group. This proves (b).
So with two separate groups of actuals, the median is a hump of the expected sMAPE. The best forecasts are near the modes, and with unequal groups the larger one wins. As the weights pass through equality, the target jumps from one mode to the other. ∎
Its formulae were also checked on numbers: E1 in the record.
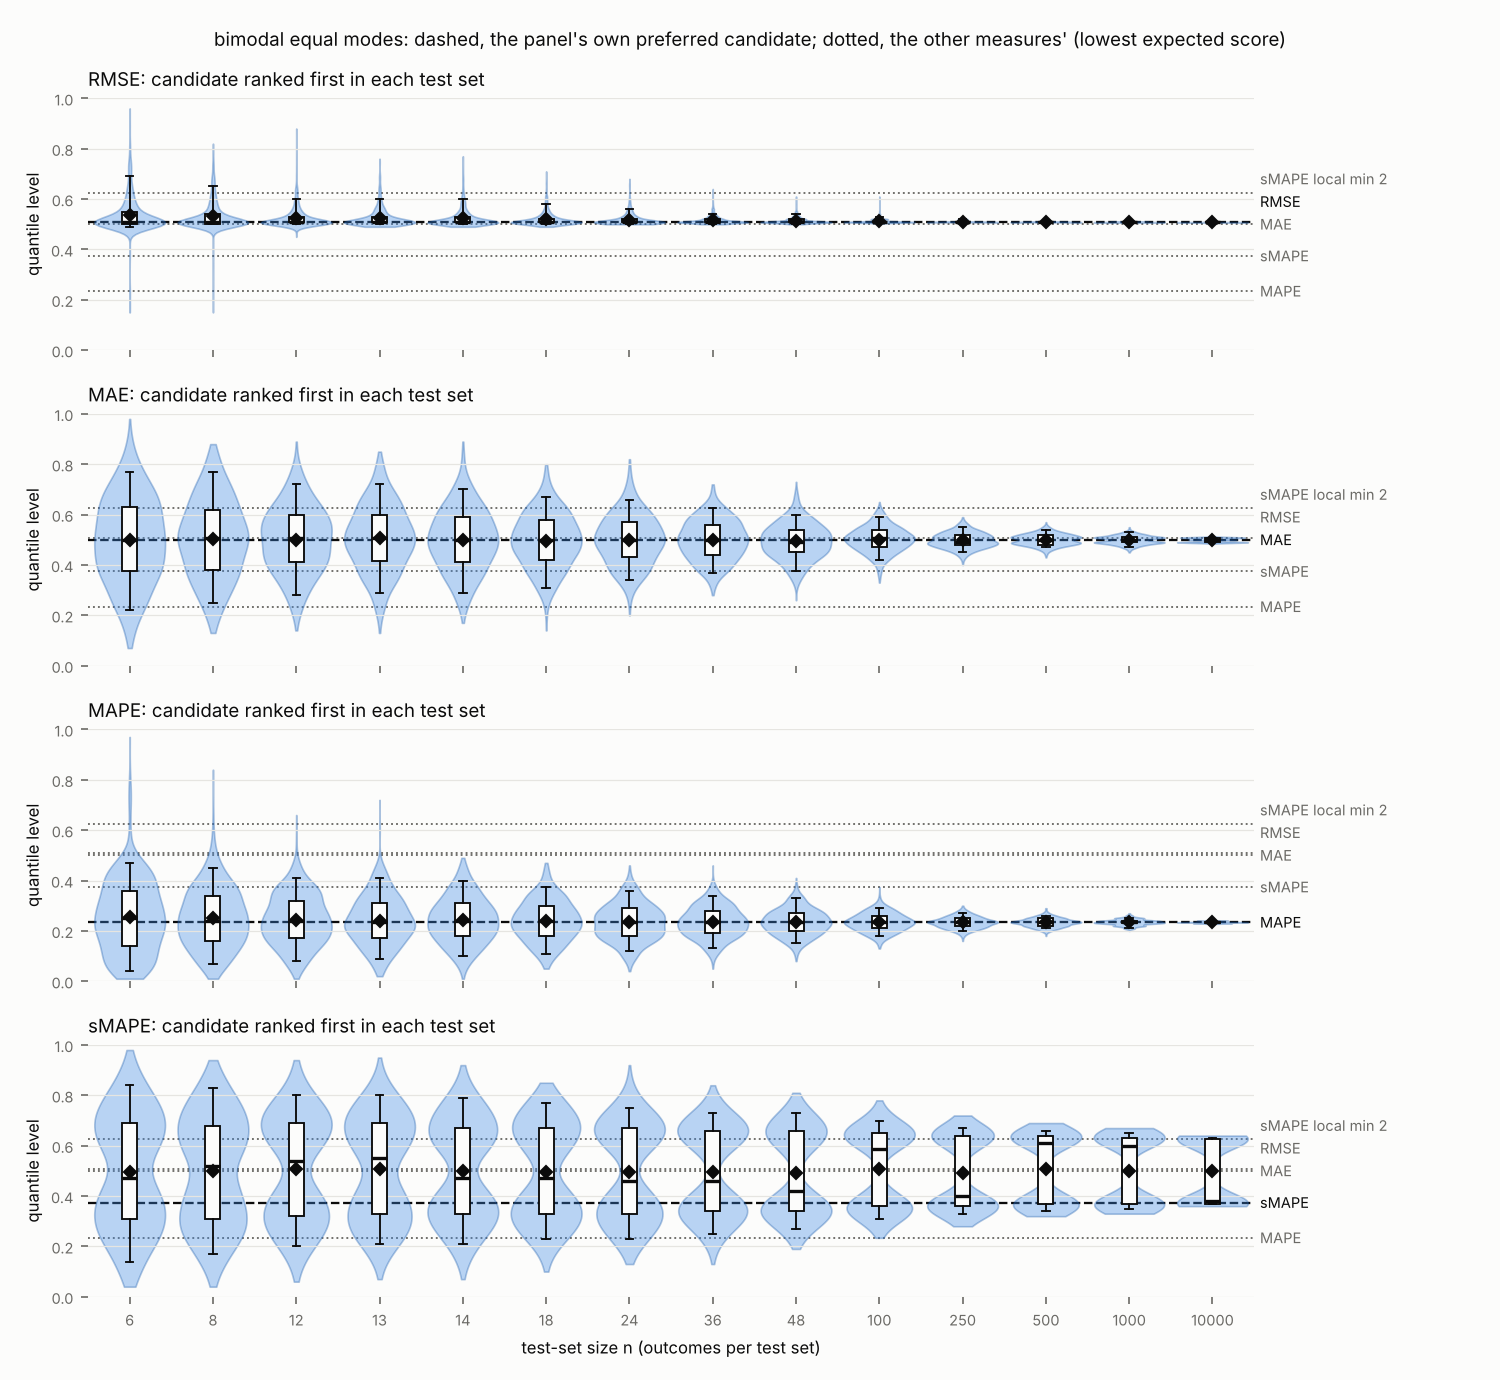
Supported by numerical check C13
Computed on bimodal outcomes, the target is two forecasts, one near each mode, when the modes are equal, and the larger mode's when they are not, as this claim proves.
Proved · checked independently by an AI agent · confirmed by Ivan Svetunkov · tested as plannedRecord
- Claim
- C6 · formal · principal · no earlier result found
- Plan
- Test planned in lab plan PL9, recorded 17 November 2026
- Evidence
- E24, E1 in the record
- Check: confirmed
- By an AI agent (proof checking), full. Derived from the statement alone (point-mass limit: tanh(a)/2 < tanh(a/2); second derivative at the median g(m) - E[sech^2 tanh]/2 < 0 for narrow groups; limit convex between the modes), then compared with the final proofs.md (paper H7), which agrees. My earlier dispute concerned the words 'exactly when', which the final wording no longer has; the claims are limits as the groups narrow.
- Check: confirmed
- By Ivan Svetunkov, full. The supervisor read the proof of paper H7 in proofs.md (AR1.R2; rendered as AR2.R2) and confirmed it: first "Confirmed" (DC6), then, after the last corrections of paper H4, H5 and H9, "All looks fine now. NExt".
- Support score
- SupportS 94 of 100. The score checks the record, not the science.
- Record
- This claim on the record page
- To cite it
- The page of this claim
Zeros and negative actuals
Claim C7. Zero actuals: when the target is zero
The worst possible score goes to forecasts of the wrong sign and to zero forecasts. With enough zeros among the actuals, sMAPE prefers the forecast 0. The share of zeros needed is below one half.
A forecast of the opposite sign to the actual, a zero forecast of a non-zero actual, and a non-zero forecast of a zero actual all give the sMAPE term its largest value, 1. Let the actual be 0 with probability and otherwise positive, and the lowest expected a positive forecast reaches on the positive actuals. The forecast 0 is the sMAPE target when , and a positive forecast does when the inequality is reversed; the threshold is below whenever .
Proof 6 steps
- When and have opposite signs, , so . When exactly one of them is 0, the numerator and the denominator both equal the absolute value of the other one, so .
- A positive forecast scores 1 on every zero actual (step 1). So its expected is plus times its expected on the positive actuals. This is at least , with equality at the best positive forecasts, which exist (claim C9).
- The forecast 0 scores 0 on zero actuals and 1 on positive ones. So its expected is . A negative forecast scores 1 on every actual, which is never better than 0.
- The forecast 0 is better when . Collecting the terms in gives . Since , this is the stated inequality.
- Compare the threshold with : exactly when , that is, when . And unless the positive actuals are all one value.
So sMAPE switches to the forecast 0 once zeros are frequent enough, and the share needed is below one half. At the threshold, the target jumps from a positive forecast to 0. ∎
Its formulae were also checked on numbers: E1 in the record.
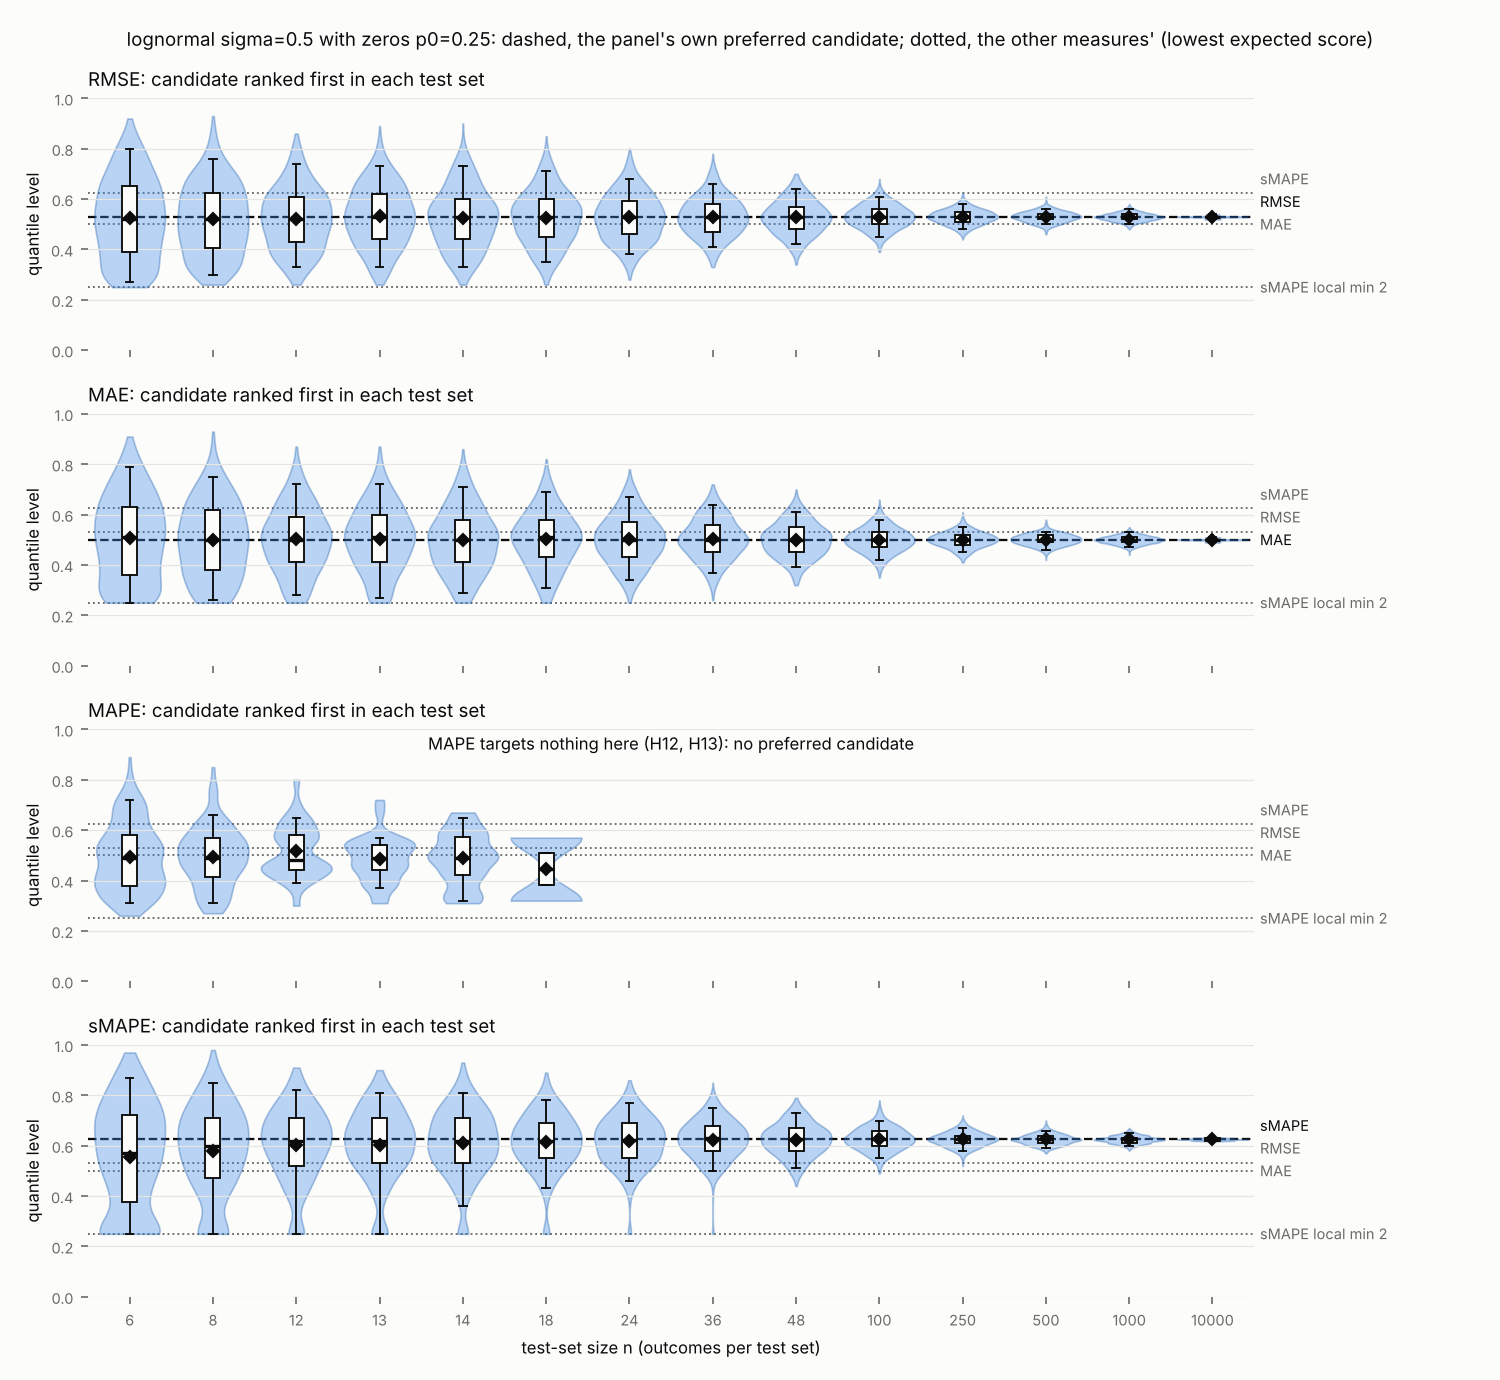
Supported by numerical check C13
Computed on lognormal outcomes with zeros, the target switches to 0 at a share of zeros below one half, as this claim proves.
Earlier work and other claims
- Refines Svetunkov (2026b), C6. C6 found sMAPE preferring zero on counts with more than half zeros; claim C7 gives the exact threshold, which is below one half whenever the positive outcomes vary.
- Extends Kolassa (2026). Kolassa (2026) shows that sMAPE elicits a zero forecast for sufficiently intermittent actuals; claim C7 gives the share of zeros at which it does, which is below one half.
Proved · checked independently by an AI agent · confirmed by Ivan Svetunkov · tested as plannedRecord
- Claim
- C7 · formal · principal · extends earlier work
- Plan
- Test planned in lab plan PL9, recorded 17 November 2026
- Evidence
- E25, E1 in the record
- Check: confirmed
- By an AI agent (proof checking), full. Derived from the statement alone (1 - p0 against p0 + (1 - p0) m+), then compared with the final proofs.md (paper H8), which agrees; the threshold (1 - m+)/(2 - m+) is my earlier (200 - m+)/(400 - m+) rescaled. The best positive forecast may be more than one value; at equality both are targets.
- Check: confirmed
- By Ivan Svetunkov, full. The supervisor read the proof of paper H8 in proofs.md (AR1.R2; rendered as AR2.R2) and confirmed it: first "Confirmed" (DC6), then, after the last corrections of paper H4, H5 and H9, "All looks fine now. NExt".
- Support score
- SupportS 100 of 100. The score checks the record, not the science.
- Record
- This claim on the record page
- To cite it
- The page of this claim
Claim C11. Actuals of both signs: the target jumps across zero
When actuals can be negative or positive, the forecast sMAPE rewards is never near zero. It is on the same side of zero as the mean. So a small shift of the mean across zero makes it jump from a negative value to a positive one.
Let the actuals be , where is symmetric about 0 and its density decreases away from 0 (for example, normal). If , every forecast with the lowest expected sMAPE is positive; if , every one is negative. These forecasts stay away from 0 as approaches 0. So as moves from slightly below 0 to slightly above, the sMAPE target jumps from a negative forecast to a positive one.
Proof 6 steps
- A positive forecast against its mirror image. Take and compare it with . An actual has the sign of , so it scores less than 1 with , and exactly 1 with (claim C7).
- The mirror actual scores 1 with . By symmetry, it scores the same amount less than 1 with . So each pair of actuals and favours when is the more likely of the two, and otherwise.
- When , every positive actual is more likely than , because is closer to and the density of the actuals falls away from . So every pair favours , and has the lower expected sMAPE. Every best forecast is therefore positive. The case is the mirror image.
- Best forecasts exist on each side. For a forecast , the actuals of its sign score below 1 and have positive probability, so its expected is below 1. As approaches 0 or grows without bound, every non-zero actual scores close to 1, so the expected approaches 1. As in claim C9, the expected is continuous in and so reaches a lowest value for ; the same holds for .
- Away from zero, uniformly. Fix a forecast . For every in a range around 0, say , its expected is at most some value , since it changes continuously with . For a forecast with , every actual with scores at least , which approaches 1 as shrinks; and the share of actuals with is small for every such : since is symmetric and its density decreases away from 0, an interval of a given length around 0 holds at least as much of its probability as any other interval of that length, so , which tends to 0 as shrinks. So for small enough, every forecast within of 0 has an expected above , for every in the range: it is worse than (or its mirror image). The best forecasts therefore stay at least from 0.
So the target is always on the same side of zero as the mean, and never near zero. It jumps from negative to positive as the mean crosses zero. ∎
Its formulae were also checked on numbers: E11 in the record.
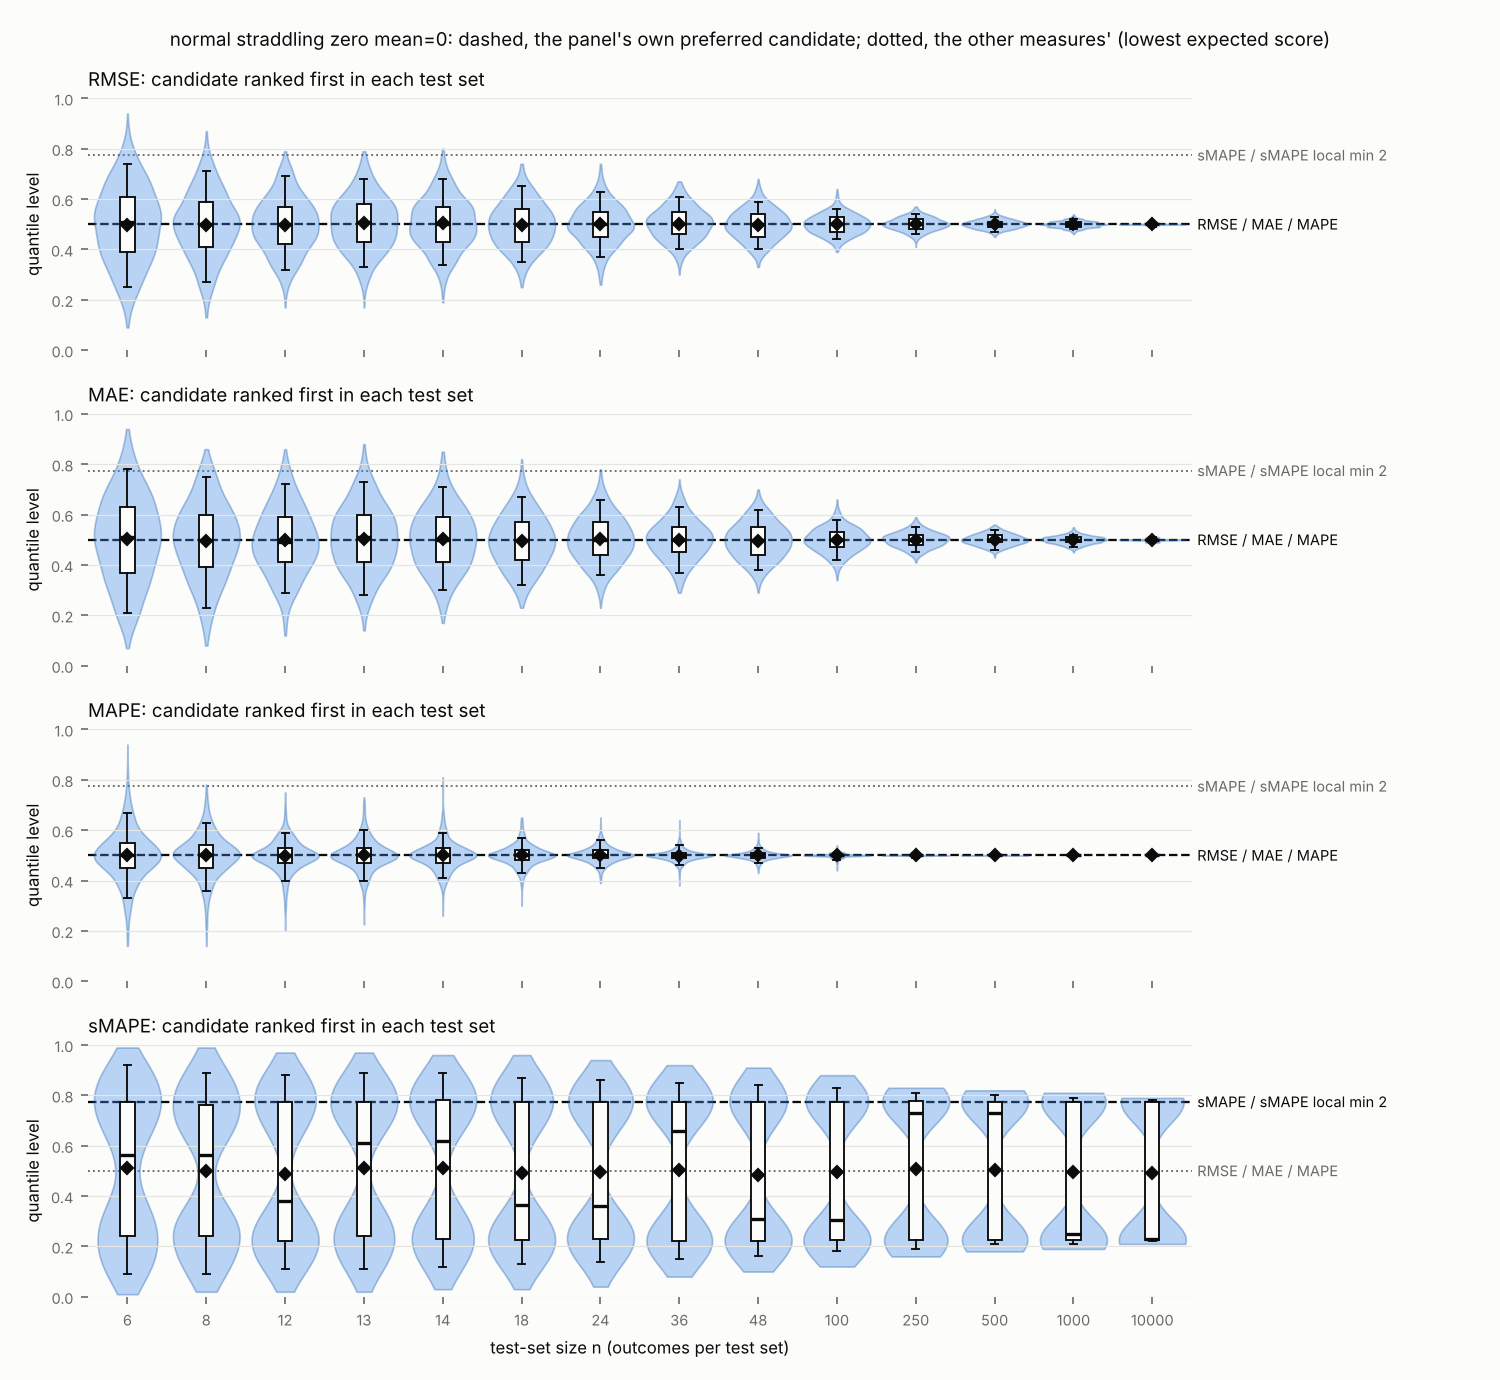
Supported by numerical check C13
Computed on normal outcomes straddling zero, the target lies away from zero, on the side of the mean, as this claim proves.
Proved · checked independently by an AI agent · confirmed by Ivan Svetunkov · tested as plannedRecord
- Claim
- C11 · formal · secondary · no earlier result found
- Plan
- Test planned in lab plan PL7, recorded 16 November 2026
- Evidence
- E26, E11 in the record
- Check: confirmed
- By an AI agent (proof checking), full. Derived from the statement alone: for f > 0, s(y,f) - s(y,-f) is odd in y and negative for y > 0, and the density at y exceeds that at -y when mu > 0, so f beats -f; 0 scores 1; near 0 the expected term tends to 1 uniformly in mu near 0 while a fixed forecast stays below 1. Then compared with the final proofs.md (paper H9), which agrees; its steps 4 and 5 leave this uniformity in mu implicit.
- Check: confirmed
- By Ivan Svetunkov, full. The supervisor read the proof of paper H9 in proofs.md (AR1.R2; rendered as AR2.R2) and confirmed it: first "Confirmed" (DC6), then, after the last corrections of paper H4, H5 and H9, "All looks fine now. NExt".
- Support score
- SupportS 100 of 100. The score checks the record, not the science.
- Record
- This claim on the record page
Widely spread actuals
Claim C10. Expected sMAPE flattens as the actuals spread out
For widely spread actuals, every forecast scores close to the worst value. The differences between forecasts shrink, and the forecast sMAPE rewards moves from the median to the most likely value on the log scale.
Let , where has a fixed density with bounded continuous first and second derivatives, and write a forecast as (its quantile level, the probability that , does not depend on ). As grows, uniformly in .
- (a)The expected sMAPE of every forecast tends to its bound 200, and the difference between forecasts at two fixed quantile levels shrinks like .
- (b)When has a single highest point , the quantile level of the sMAPE target tends to that of , the mode of , which differs from 1/2 when the mode of is not its median.
- (c)As , when has a unique median and a finite , the quantile level of the target tends to 1/2: sMAPE targets the median for narrow distributions and the mode of for wide ones.
Proof 10 steps
- Rewrite the expectation. By claim C3, and since , . The density of at is . Substituting in the integral gives
- Expand . By Taylor's theorem, for some between and .
- The first term integrates to , since . Over , .
- The second term integrates to 0: its factor changes sign with , while the rest does not.
- The third term is at most times , divided by . This integral is a standard Fermi–Dirac integral. With the factor of step 1, this gives the expansion.
- (a). The expansion tends to 1, so the expected sMAPE tends to 200. Two forecasts at fixed quantile levels have fixed positions and . So their difference is .
- (b). Minimising the expansion over is maximising , up to a term that shrinks like for every at once. A density with a bounded derivative tends to 0 far out. So its single highest point stands clear of every other point, and the minimisers' positions tend to . So do their quantile levels.
- (c). By claim C3 (b), lies between 0 and . So for in any bounded range, . This uses . And is smallest at the median of .
- The minimisers also stay in a bounded range. For large , most actuals have at least from . And for . So grows with , or exceeds a multiple of , beyond its value at the median. So the minimisers' positions tend to the median of , whose quantile level is .
So as the actuals spread out, the expected sMAPE flattens towards its bound. Differences between forecasts vanish like . The target moves from the median to the mode of . ∎
Its formulae were also checked on numbers: E1 in the record.
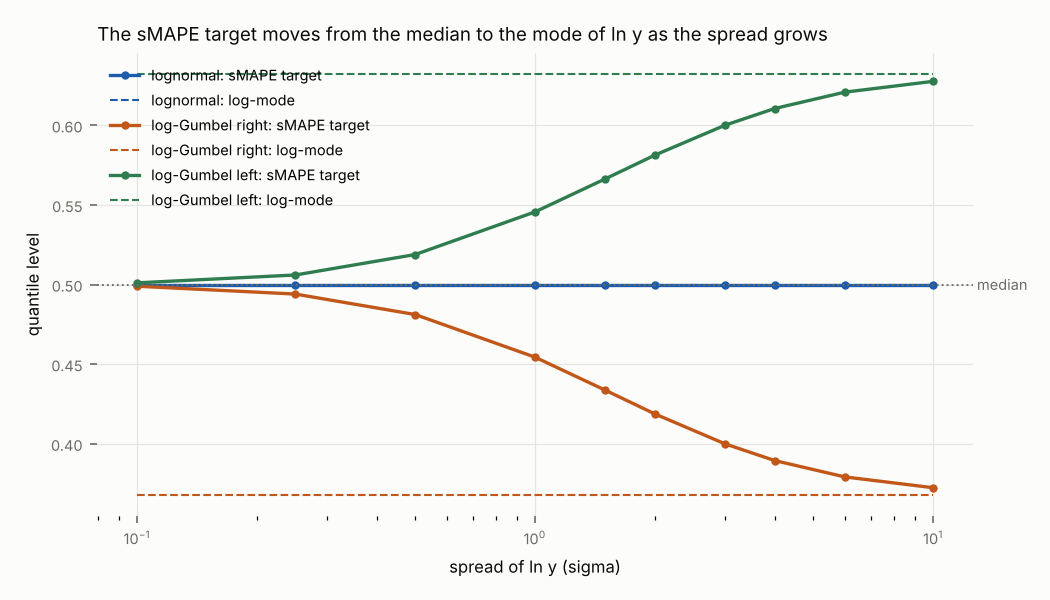
Supported by numerical check C14
Computed for spreads of ln y from 0.1 to 10, expected sMAPE flattens and the target moves to the mode of ln y, as this claim proves for large spreads.
Elsewhere in this paper
Earlier work and other claims
- Supports Svetunkov (2026a), C6. C6 recommends against sMAPE for point forecasts; claim C10 shows that on widely spread actuals every forecast scores close to the worst value and the target moves to the mode of ln y.
- Supports Kolassa (2026). Kolassa (2026) concludes that sMAPE should not be used; claim C10 shows that on widely spread actuals every forecast scores close to the worst value.
Proved · checked independently by an AI agent · confirmed by Ivan Svetunkov · tested as plannedRecord
- Claim
- C10 · formal · principal · no earlier result found
- Plan
- Test planned in lab plan PL9, recorded 17 November 2026
- Evidence
- E28, E1 in the record
- Check: confirmed
- By an AI agent (proof checking), full. Derived from the statement alone (integral of 2/(1+e^|v|) is 4 ln 2, odd term vanishes, remainder at most 3 zeta(3) sup|g''|/sigma^3 uniformly in c; checked numerically for the normal), then compared with the final proofs.md (paper H11), which agrees; the constant 4 ln 2 is my earlier 800 ln 2 rescaled. (b) and (c) are claims about the quantile level, which is what holds in general.
- Check: confirmed
- By Ivan Svetunkov, full. The supervisor read the proof of paper H11 in proofs.md (AR1.R2; rendered as AR2.R2) and confirmed it: first "Confirmed" (DC6), then, after the last corrections of paper H4, H5 and H9, "All looks fine now. NExt".
- Support score
- SupportS 100 of 100. The score checks the record, not the science.
- Record
- This claim on the record page
- To cite it
- The page of this claim
Terms this claim uses
- signal-to-noise ratio of a comparison
- For a measure with term , two forecasts and and a distribution of the actual : , where is the difference of the two forecasts' scores on one actual. Over a test set of independent actuals the mean of is times this many of its standard errors from zero: the larger the ratio, the smaller the test set that tells the two forecasts apart.
- MAE
- Mean absolute error of a point forecast over a test set of actuals : .
- RMSE
- Root mean squared error of a point forecast over a test set of actuals : .
Claim C18. sMAPE loses its power to tell forecasts apart as the actuals spread out
For widely spread actuals a test set tells two forecasts apart less and less well under sMAPE: the signal-to-noise ratio of their score difference falls like one over the square root of the spread. The absolute log error and MAE keep their power.
Let , where has a fixed density with bounded continuous first and second derivatives and distribution function , and compare two forecasts at fixed quantile levels, and with , by their signal-to-noise ratio of a comparison.
- (a)For the sMAPE term, as grows, So when the ratio is it falls to zero like , and the size of the test set that keeps the mean difference a given number of standard errors from zero grows in proportion to .
- (b)For the absolute log error (log-MAE), , so the ratio, wherever , does not depend on .
- (c)For the absolute error (MAE), as grows the ratio tends to when ; the limit is positive unless the higher forecast is the median.
- (d)For the squared error (RMSE), when is finite the ratio is ; for lognormal actuals, times the ratio tends to 1 as grows. For widely spread actuals, then: the absolute log error keeps its power to tell two forecasts apart wherever its ratio is defined. The absolute error keeps it when and the higher forecast is not the median. sMAPE loses it at the rate when . It loses it faster, with a ratio of at most order , when . The squared error on lognormal actuals loses it faster than any power of .
Proof 10 steps
- The sMAPE difference. Write , so that , and . By claim C3 the sMAPE term of the forecast is , because . So .
- Its mean. By claim C10, . So .
- The mean of . Substituting , as in claim C10, step 1, . Expanding by Taylor's theorem, as in claim C10, step 2: the first term integrates to ; the second integrates to 0, because its factor changes sign with while the rest does not; the third is at most divided by , and this integral is finite because . Since , whose two parts integrate over to and , . So .
- The cross term. Since , , because . So , which is smaller than every power of .
- The variance. . By steps 2 to 4 this is ; the term is of order .
- (a). When , . Dividing the size of the mean (step 2) by the square root of the variance (step 5) gives the stated ratio. To keep times the ratio at a given value, must be that value squared over the ratio squared, which grows in proportion to . When instead, the mean is (step 2) while the variance is still of order (step 5), so the ratio is : at most of that order.
- (b). For the absolute log error, , so . It is bounded by , so its mean and standard deviation exist. Both are times those of , whose distribution does not depend on . So their ratio, wherever the standard deviation is not zero, does not depend on .
- (c). For the absolute error, with . It equals when , when , and when ; so . Now tends to 0, and for every , tends to 0. So tends to 1 for and to for . By bounded convergence, and . So the variance of tends to , and the ratio, which is the same for and , tends to the stated limit when . The limit is 0 only when .
- (d). For the squared error, . So and , finite when is. Their ratio is the stated one. For lognormal actuals , and , which tends to 0. So times the ratio is , which tends to 1.
So for widely spread actuals the absolute log error keeps its power to tell two forecasts apart wherever its ratio is defined. The absolute error keeps it when and the higher forecast is not the median. sMAPE loses it at the rate when . It loses it faster, with a ratio of at most order , when . The squared error on lognormal actuals loses it faster than any power of . ∎
Its formulae were also checked on numbers: E32 in the record.
Earlier work and other claims
- Supports Svetunkov (2026a), C6. C6 recommends against sMAPE for point forecasts; claim C18 shows that on widely spread actuals a test set tells two forecasts apart less and less well under sMAPE.
- Supports Kolassa (2026). Kolassa (2026) concludes that sMAPE should not be used; claim C18 shows that on widely spread actuals a test set tells two forecasts apart less and less well under sMAPE.
- Refines claim C10. Claim C10 shows that the scores of forecasts at fixed quantile levels move together like 1/σ. Claim C18 adds the noise and shows that the signal-to-noise ratio falls like σ^(-1/2), while that of the absolute log error does not change.
Proved · checked independently by an AI agent · tested as plannedRecord
- Claim
- C18 · formal · principal · no earlier result found
- Plan
- Test planned in lab plan PL17, recorded 18 November 2026
- Evidence
- E35, E32 in the record
- Check: disputed
- By an AI agent (proof checking, version 3), full. Derived independently. (a) With $q(v)=1-\tanh(|v|/2)=2/(1+e^{|v|})$, $\mathrm E[q(\sigma(\varepsilon-c))]=\frac1\sigma\int q(u)h(c+u/\sigma)du=4\ln2\,h(c)/\sigma+O(\sigma^{-3})$ (the $h'$ term vanishes by symmetry; the remainder is bounded by $\tfrac12\sup|h''|\int u^2q/\sigma^3$). Likewise $\mathrm E[q^2]=4(2\ln2-1)h(c)/\sigma+O(\sigma^{-3})$ with $\int q^2=8(\ln2-\tfrac12)$; the cross term is at most $4e^{-\sigma(c_2-c_1)}$; $(\mathrm E D)^2=O(\sigma^{-2})$. So both expansions and their remainder orders hold, and the ratio is as stated with relative error $O(1/\sigma)$ (from the variance), with $h(c_1)+h(c_2)>0$ when $h(c_1)\ne h(c_2)$. A quadrature check (normal $h$, $c_1=-0.3$, $c_2=0.8$, $\sigma$ up to 160) agrees. (b) is immediate; $D$ is bounded by $\sigma(c_2-c_1)$. (c) $D/f_2\to\mathbf 1\{\varepsilon<c_2\}-\mathbf 1\{\varepsilon>c_2\}$ a.s. with $|D/f_2|\le1$, so $\mathrm E[D/f_2]\to2H(c_2)-1$ and $\operatorname{Var}(D/f_2)\to4H(c_2)(1-H(c_2))$. The stated limit therefore holds only when $0<H(c_2)<1$. The statement does not give this condition, and the proof (H13 step 8) adds it. The hypotheses allow it to fail: $h$ may have bounded support, e.g. $h\propto(1-x^2)^3$ on $[-1,1]$, which has bounded continuous $h'$ and $h''$. If $H(c_2)=1$ the formula is $1/0$ (when $c_1$ is inside the support the ratio tends to infinity; when it is not, $D$ is constant and the ratio is undefined for every $\sigma$). If $H(c_2)=0$, $D$ is constant and the ratio is undefined for every $\sigma$. (d) $D=(f_2-f_1)(f_1+f_2-2Y)$ gives the ratio exactly; for lognormal actuals $e^{\sigma^2/2}$ times the ratio is $|1-(f_1+f_2)/(2\mathrm EY)|\,e^{\sigma^2/2}/\sqrt{e^{\sigma^2}-1}\to1$. Every computation in the proof is correct. The dispute concerns only the missing condition in (c). Suggested wording: "(c) ... as $\sigma$ grows the ratio tends to $|2H(c_2)-1|/(2\sqrt{H(c_2)(1-H(c_2))})$ when $0<H(c_2)<1$, which is positive unless the higher forecast is the median." Optionally, also in (b): "wherever $\mathrm{sd}(D)>0$" (it is 0 when $\varepsilon\le c_1$ a.s. or $\varepsilon\ge c_2$ a.s.). The closing sentence is also loose: sMAPE loses power at the rate $\sigma^{-1/2}$ only when $h(c_1)\ne h(c_2)$ (otherwise faster), and the absolute error keeps it only when $H(c_2)\ne1/2$. It would be safer as "for widely spread actuals, comparisons of forecasts with $h(c_1)\ne h(c_2)$ ...". The statement was corrected, and the checker confirmed the corrected wording in a later check listed here.
- Check: disputed
- By an AI agent (proof checking, version 3), full. Re-checked every part as now worded, against the revised H13. (a) is unchanged from H39 and correct: $\mathrm E[q]=4\ln2\,h(c)/\sigma+O(\sigma^{-3})$ and $\mathrm E[q^2]=4(2\ln2-1)h(c)/\sigma+O(\sigma^{-3})$; the cross term is at most $4e^{-\sigma(c_2-c_1)}$; the ratio is as stated with relative error $O(1/\sigma)$. (b), "wherever $\mathrm{sd}(D)>0$", is correct. (c), now with "when $0<H(c_2)<1$", is correct: $D/f_2\to\mathbf 1\{\varepsilon<c_2\}-\mathbf 1\{\varepsilon>c_2\}$ boundedly, and quadrature agrees. (d) is correct. One point remains, in the closing sentence: "sMAPE loses it, at the rate $\sigma^{-1/2}$ when $h(c_1)\ne h(c_2)$". This asserts that sMAPE loses its power in every case, but neither the statement nor the proof (whose closing paragraph repeats it) shows this when $h(c_1)=h(c_2)$. If $h(c_1)=h(c_2)>0$, it follows from (a) in one line: $|\mathrm E D|=O(\sigma^{-3})$ and $\operatorname{Var}D\sim8(2\ln2-1)h(c_1)/\sigma$, so the ratio is $O(\sigma^{-5/2})$. The proof should say this. If $h(c_1)=h(c_2)=0$ (possible when $h$ vanishes at a point or has bounded support), (a) gives only $\mathrm E D=O(\sigma^{-3})$ and $\operatorname{Var}D=O(\sigma^{-2})$, which do not bound the ratio. I could not derive the claim in that case. It is true in the cases I computed: $h\propto(1-x^2)^3$ with $(c_1,c_2)=(1.5,2)$ or $(-1.5,2)$ gives a ratio falling like $\sigma^{-2}$; $(-1.3,1.3)$ gives 0. The gap is my own doing: my note on H39 suggested "otherwise faster" without having proved the zero-density case. Suggested wording: "sMAPE loses it when $h(c_1)+h(c_2)>0$, at the rate $\sigma^{-1/2}$ when $h(c_1)\ne h(c_2)$ and faster when $h(c_1)=h(c_2)$", with the one-line argument above added to the proof. Alternatively, keep only "sMAPE loses it at the rate $\sigma^{-1/2}$ when $h(c_1)\ne h(c_2)$". Smaller and optional: "the absolute error keeps it unless the higher forecast is the median" omits the condition $0<H(c_2)<1$ of (c) (with $H(c_2)=0$ the ratio is undefined); adding "when $0<H(c_2)<1$" would make it exact. With these changes I would confirm. The statement was corrected, and the checker confirmed the corrected wording in a later check listed here.
- Check: disputed
- By an AI agent (proof checking, version 3), full. Parts (a)-(d) are unchanged from H43 and correct (checked in CK30 and CK34). I judged each sentence of the new closing against them. (1) The absolute log error keeps its power wherever its ratio is defined: this follows from (b). (2) The absolute error keeps it when $0<H(c_2)<1$ and the higher forecast is not the median: this follows from (c), whose limit is then positive. (3) sMAPE loses it at the rate $\sigma^{-1/2}$ when $h(c_1)\ne h(c_2)$: this follows from (a). (5) The squared error on lognormal actuals: (d) gives $e^{\sigma^2/2}\cdot\text{ratio}\to1$, so the ratio is $e^{-\sigma^2/2}(1+o(1))=o(\sigma^{-k})$ for every $k$, for every $c_1<c_2$; this is fully covered by (d), and lognormal actuals (normal $h$) meet the hypotheses. (4), "It loses it faster, with a ratio of order $\sigma^{-5/2}$, when $h(c_1)=h(c_2)>0$", is not established as worded. (a) gives $\mathrm E[D]=O(\sigma^{-3})$, an upper bound only, and $\operatorname{Var}(D)=8(2\ln2-1)h(c_1)/\sigma+O(\sigma^{-2})$, which is exactly of order $1/\sigma$. So the ratio is $O(\sigma^{-5/2})$: at most of order $\sigma^{-5/2}$, which does establish "loses it faster". But "a ratio of order $\sigma^{-5/2}$" naturally reads as the exact order, and that is false in general. The $\sigma^{-3}$ coefficient of $\mathrm E[D]$ is proportional to $h''(c_1)-h''(c_2)$, which can vanish: for a symmetric $h$ with $c_1=-c_2$, $\mathrm E[D]=0$ exactly and the ratio is 0 for every $\sigma$. The proof's new sentence in step 6 has the same slip: "the mean is of order $\sigma^{-3}$ (step 2)", whereas step 2 gives only $O(\sigma^{-3})$. Suggested wording: "It loses it faster, with a ratio of at most order $\sigma^{-5/2}$ ($O(\sigma^{-5/2})$), when $h(c_1)=h(c_2)>0$", and in proof step 6 "the mean is $O(\sigma^{-3})$ ... so the ratio is $O(\sigma^{-5/2})$". With that change I would confirm. Separately, I checked the revised H12 step 6 (behind H38): the weights 0.406125, 0.054825 and 0.539050 now sum to 1; the parameters are correctly marked as rounded; and "rises through $m$, where it is flat" matches my computation ($\phi'\ge0$ on both sides of 0). It is now right. The statement was corrected, and the checker confirmed the corrected wording in a later check listed here.
- Check: confirmed
- By an AI agent (proof checking, version 3), full. A word diff against H45 shows that the only change is "at most" in the sentence I disputed in CK36. Parts (a)-(d) are correct, as checked in CK30, CK34 and CK36. I judged each closing sentence against them. The absolute log error keeps its power wherever its ratio is defined: this follows from (b). The absolute error keeps it when $0<H(c_2)<1$ and the higher forecast is not the median: this follows from (c). sMAPE loses it at the rate $\sigma^{-1/2}$ when $h(c_1)\ne h(c_2)$: this follows from (a). "It loses it faster, with a ratio of at most order $\sigma^{-5/2}$, when $h(c_1)=h(c_2)>0$" is now exactly what (a) gives. The mean is $O(\sigma^{-3})$ and the variance is $8(2\ln2-1)h(c_1)/\sigma+O(\sigma^{-2})$, exactly of order $1/\sigma$, so the ratio is $O(\sigma^{-5/2})$; the bound allows the ratio to be smaller, even 0 (symmetric $h$, $c_1=-c_2$). The squared error on lognormal actuals loses its power faster than any power of $\sigma$: by (d) the ratio is $e^{-\sigma^2/2}(1+o(1))$, for every $c_1<c_2$. The revised proof step 6 writes $O(\sigma^{-3})$ and $O(\sigma^{-5/2})$ ("at most of that order"), and the closing paragraph matches the statement. Every part and every closing sentence holds as worded, and the proof establishes them.
- Support score
- SupportS 100 of 100. The score checks the record, not the science.
- Record
- This claim on the record page
- To cite it
- The page of this claim
Other measures
Term this claim uses
- MAPE
- Mean absolute percentage error of a point forecast over a test set of actuals : ; infinite when an actual is zero.
Claim C8. Where RMSE, MAE and MAPE fail, and what they then target
RMSE, MAE and MAPE each have an infinite expected value, for every forecast, when a moment they need is infinite. What each then rewards depends on the measure.
For a positive random actual :
- (a)RMSE: is finite exactly when is; when is infinite but finite, every difference between two forecasts and , is finite and the mean is preferred to every other forecast; when is infinite no forecast is preferred to all others.
- (b)MAE: is finite exactly when is; otherwise differences are finite and a median is still preferred.
- (c)MAPE: when is finite, the expected MAPE is finite and minimised by a median of the actuals weighted by ; when is infinite, every positive forecast has infinite expected MAPE while the forecast 0 has MAPE 100, so MAPE targets 0; when is 0 with positive probability, MAPE is infinite or undefined for every forecast and targets nothing.
Proof 12 steps
- (a) RMSE. If is finite, so is . Expanding the square gives , which is finite. Conversely, . So a finite makes finite.
- Expanding both squares gives . Its expectation is finite when is, and equals .
- For this is negative for every . So the mean is preferred.
- If is infinite, then for the expectation in step 2 is . Every forecast is beaten by any larger one, so none is preferred to all others.
- (b) MAE. Since , is infinite when is. Otherwise it is at most .
- The difference is at most in size, so its expectation is finite.
- The derivative of in is . The expectation of this is , which is negative below a median and positive above it. So a median is preferred.
- (c) MAPE. For , the contribution of an actual to MAPE, divided by 100, is . This is at least . So the expected MAPE is infinite when is, and at most otherwise.
- As a function of , is convex. Its derivative is . Its expectation is 0 where the actuals below and those above it have equal total weight : at a median of the actuals weighted by .
- The forecast 0 gives for every actual, so MAPE 100. A negative forecast gives more than 1. So when is infinite, 0 is the only forecast with a finite expected MAPE.
- If with positive probability: for that actual contributes , which is infinite. For it contributes , which is undefined.
So each of RMSE, MAE and MAPE has an infinite expected value when a moment it needs is infinite. RMSE and MAE still rank forecasts by their differences. MAPE turns to the forecast 0, and with zero actuals it targets nothing. ∎
Its formulae were also checked on numbers: E1 in the record.
Proved · checked independently by an AI agent · confirmed by Ivan Svetunkov · tested as plannedRecord
- Claim
- C8 · formal · secondary · no earlier result found
- Plan
- Test planned in lab plan PL9, recorded 17 November 2026
- Evidence
- E27, E1 in the record
- Check: confirmed
- By an AI agent (proof checking), full. Derived from the statement alone, then compared with the final proofs.md (paper H10), which agrees in all three parts. When E[1/Y] is infinite, negative forecasts also have infinite expected MAPE, so 0 is the only finite one.
- Check: confirmed
- By Ivan Svetunkov, full. The supervisor read the proof of paper H10 in proofs.md (AR1.R2; rendered as AR2.R2) and confirmed it: first "Confirmed" (DC6), then, after the last corrections of paper H4, H5 and H9, "All looks fine now. NExt".
- Support score
- SupportS 100 of 100. The score checks the record, not the science.
- Record
- This claim on the record page
sMAPE modifications
Term this claim uses
- Suilin term
- The contribution of one actual and one forecast to the Suilin loss: the Suilin loss is 200 times its mean over a test set. It replaces the denominator of the sMAPE term. Proposed by Suilin (2017) in code for a Kaggle competition, as a smoothed variant of sMAPE; defined in print by Hewamalage, Bergmeir and Bandara (2021, Eq. 15), who write the constant as and the factor 2 into the measure differently (a constant factor changes no property here). Hewamalage, Ackermann and Bergmeir (2023) call it msMAPE; Smyl (2025) gives that name to a different measure, so this study follows Kolassa (2026) and calls it the Suilin loss. Version 2 of this paper called it msMAPE.
Claim C17. The Suilin loss behaves like sMAPE except near zero
The Suilin loss behaves like sMAPE except near zero, where it becomes an absolute error.
The Suilin term has the properties of the sMAPE term except near zero.
- (a)Where , the sMAPE term shrunk by a factor between and 1 that tends to 1 as grows. So for actuals and forecasts large compared with , is close to , though no longer exactly a function of the ratio ; on counts, where every actual is 0 or at least 1, this case covers every pair except a zero actual with .
- (b)Where , , an absolute error: a zero forecast of a zero actual scores 0, and a forecast with of a zero actual scores , where the sMAPE term gives every non-zero forecast of a zero actual its largest value, 1.
- (c) everywhere, so the expected Suilin loss of every forecast is finite.
Proof 8 steps
- Which branch of the maximum. exactly when . So the denominator of is when , and when .
- (a), the identity. When , , so and . By step 1, .
- (a), the factor. The function is increasing in , below 1, and tends to 1 as grows. At it equals . So for it lies in .
- (a), close to , but not a function of the ratio. By steps 2 and 3, , since (step 7). So is within of , which shrinks as grows. But depends on the scale: and have the same ratio and the same , while and . So is not a function of alone.
- (a), counts. If , then . If , then , which is at least 0.5 unless . So on counts only a zero actual with has .
- (b). When , by step 1, . For this is 0. For and it is . And for , the largest value of (step 7).
- (c). (the triangle inequality), so . When , (step 3). When , . And because it is a ratio of a non-negative number to a positive one. A quantity between 0 and 1 has an expectation between 0 and 1, whatever the joint distribution of actuals and forecasts, so the expected Suilin loss is between 0 and 200.
So the Suilin term is the sMAPE term shrunk by a factor between 5/6 and 1 wherever , and an absolute error where : it differs from sMAPE in kind only near zero. ∎
Its formulae were also checked on numbers: E31 in the record.
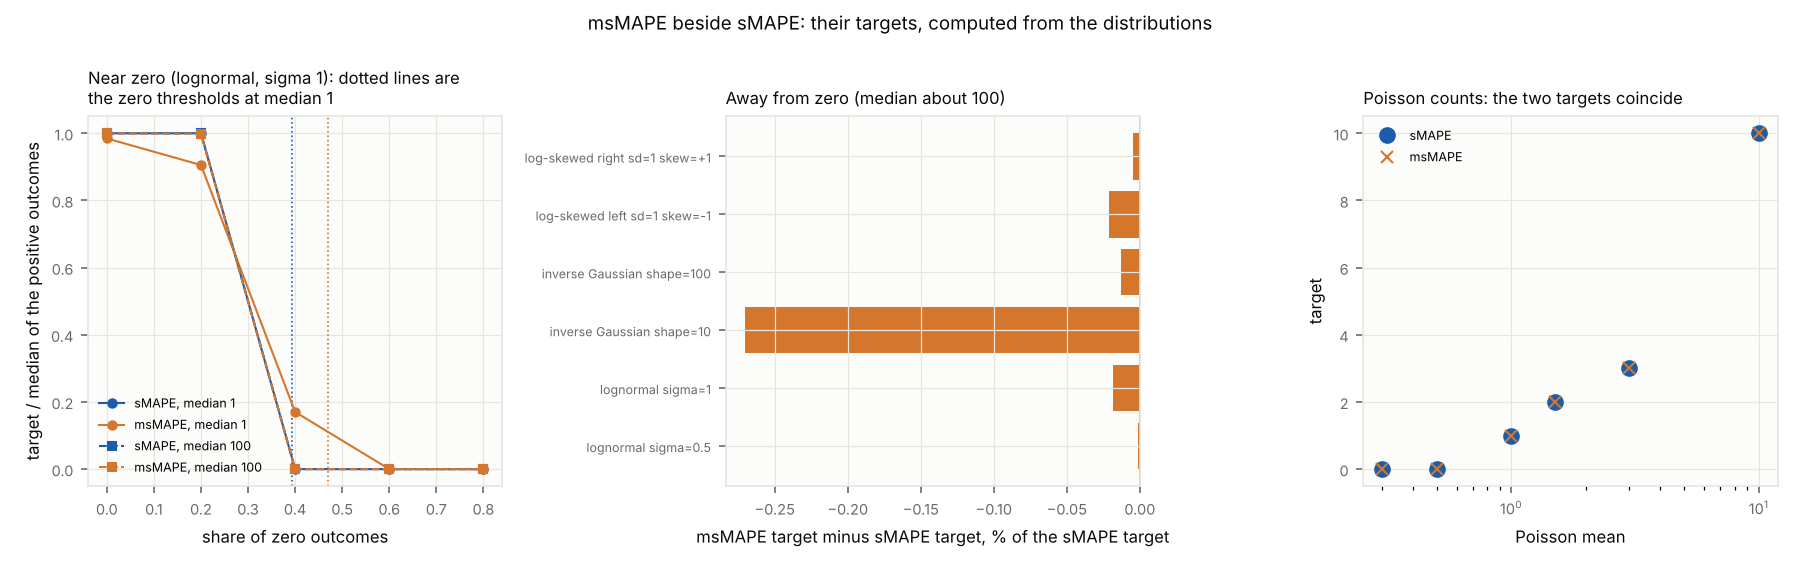
Supported by numerical check C16
Computed on actual distributions, the Suilin target stays at the sMAPE target away from zero and moves near zero, as this claim's two cases imply.
Earlier work and other claims
- Extends Hewamalage et al. (2021). Hewamalage, Bergmeir and Bandara (2021) evaluate forecasts with the Suilin loss, Suilin's modification of sMAPE for series with values near zero; claim C17 shows that it keeps sMAPE's behaviour away from zero and becomes an absolute error near zero.
Proved · checked independently by an AI agent · checked independently by an AI agent · tested as plannedRecord
- Claim
- C17 · formal · principal · extends earlier work
- Plan
- Test planned in lab plan PL12, recorded 18 November 2026
- Evidence
- E30, E31 in the record
- Check: confirmed
- By an AI agent (proof checking), full. Derived from the statement alone, then compared with proof-msmape.md. Write t = |y|+|f|. The denominator max(t+eps, 0.5+eps) is t+eps exactly when t >= 0.5, and the two branches agree at t = 0.5 (both 0.6), so m is continuous there. (a) For t >= 0.5, t > 0, so |y-f| = s t and m = s t/(t+eps); the factor t/(t+eps) = 1 - eps/(t+eps) is increasing, equals 5/6 at t = 0.5, is strictly below 1 and tends to 1, so it lies in [5/6, 1): the bound 5/6 is attained, 1 is not. s - m = s eps/(t+eps) <= eps/(t+eps), so m is close to s when t is large compared with eps. m is not a function of y/f: (1,2) and (10,20) have the same ratio and the same s = 1/3, but m = 1/3.1 and 10/30.1. On counts, y >= 1 gives t >= 1, and y = 0 gives t = |f|, so only a zero actual with |f| < 0.5 falls outside this case; this holds for forecasts of any sign and any real value. (b) For t < 0.5, m = |y-f|/0.6; m(0,0) = 0; m(0,f) = |f|/0.6 for |f| < 0.5; s(0,f) = |f|/|f| = 1 for every f != 0, and 1 is the largest value of s because |y-f| <= |y|+|f|. (c) m >= 0, and |y-f| <= t < t+eps <= denominator gives m < 1 strictly in both branches, with supremum 1 not attained (opposite signs, t large); a bounded term has a finite expectation under every joint distribution of actuals and forecasts, so expected msMAPE lies in [0, 200). Checked with exact rational arithmetic on 400000 random pairs of mixed signs and scales, including zeros and the boundary t = 0.5: no violation. Every step of proof-msmape.md (1 to 6) holds. Three clauses of the recorded statement are true but have no step in the proof, whose restated Statement omits them: that m is close to s for values large compared with eps (needs the bound s - m <= eps/(t+eps)), that m is no longer exactly a function of y/f (needs one counterexample such as the one above), and that 1 is the largest value of the sMAPE term (follows from the triangle inequality used in step 6 but is not said). The opening sentence, that m has the properties of the sMAPE term except near zero, is a summary and holds only as parts (a) to (c) qualify it: exact dependence on the ratio y/f alone is lost at every scale, not only near zero, and m never reaches the value 1 that s reaches for opposite signs or a zero actual.
- Check: confirmed
- By an AI agent (proof checking, version 3), full. Derived independently. With $\ell=|y|+|f|$, the denominator $\max(\ell+\delta,0.5+\delta)$ is $\ell+\delta$ exactly when $\ell\ge0.5$. (a) Then $\ell>0$, $|y-f|=s\ell$, $\tilde s=s\,\ell/(\ell+\delta)$, and $\ell/(\ell+\delta)$ is increasing from $0.5/0.6=5/6$ towards 1, never reaching 1. It depends on scale: $(1,2)$ and $(10,20)$ have equal $s$ but different $\tilde s$. On counts, $y\ge1$ gives $\ell\ge1$, and $y=0$ gives $\ell=|f|$, so only a zero actual with $|f|<0.5$ falls outside. (b) For $\ell<0.5$, $\tilde s=|y-f|/0.6$; $(0,0)$ scores 0, $(0,f)$ scores $|f|/0.6$, and $s(0,f)=1=\max s$ for $f\ne0$. (c) In case (a), $\tilde s\le s\cdot\ell/(\ell+\delta)<1$ since $s\le1$. In case (b), $\tilde s\le\ell/0.6<5/6$. And $\tilde s\ge0$, so every expectation is finite. The proof (proof-suilin.md, first proof) matches each step. Every part holds as worded.
- Support score
- SupportS 100 of 100. The score checks the record, not the science.
- Record
- This claim on the record page
- To cite it
- The page of this claim
Term this claim uses
- msMAPE term
- The contribution of one actual and one forecast to the sparse-proof sMAPE (msMAPE) of Smyl (2025), as Kolassa (2026, Definition 4) states it, for a small constant (Kolassa writes it , which is the median here): which is 0 when ; msMAPE is 200 times its mean over a test set (Kolassa writes the factor 2 into the term). It replaces the actual in the denominator of the sMAPE term by when the actual is below .
Claim C20. msMAPE is sMAPE except for small actuals
Smyl's msMAPE equals sMAPE for actuals of at least its constant ν. Below ν its denominator stops shrinking. A zero actual then no longer gives every non-zero forecast the worst score, and the expected score has no jump at the zero forecast.
The msMAPE term is the sMAPE term except for actuals below . For , and :
- (a)Where , ; so when every actual is at least , msMAPE is sMAPE and has the same target.
- (b)Where , : for a zero actual it is , which is 0 at and rises towards 1 as grows, where the sMAPE term is 1 for every .
- (c), with where ; and for every , is continuous in at , so the expected msMAPE term has no jump at the zero forecast, where the expected sMAPE term jumps when zero actuals have positive probability.
- (d)On counts with , differs from only for zero actuals.
Proof 6 steps
- (a). When , , and because . So , which is for non-negative and . If every actual is at least , the two measures are then the same function of the forecast on every test set and under every distribution of such actuals, so they have the same minimisers.
- (b). When , , so . For this is , which is 0 at , increasing in , below 1, and tends to 1 as grows. The sMAPE term of a zero actual is for every .
- (c), the bounds. because its numerator is non-negative and its denominator is at least . Where , , since . Where : if , ; if , . So there.
- (c), no jump at zero. The denominator is at least for every , so is a continuous function of on , at too. Since (step 3), the expected term is continuous in as well, by bounded convergence. The sMAPE term of a zero actual is 0 at and 1 for ; so when zero actuals have probability , the expected sMAPE term jumps by at .
- (d). A count is 0 or at least 1. With , a count of at least 1 is at least , so by step 1. A zero count is below , where and for (step 2).
So the msMAPE term is the sMAPE term for actuals of at least . Below its denominator no longer shrinks with the actual: a zero actual scores , and the expected msMAPE has no jump at the zero forecast. ∎
Its formulae were also checked on numbers: E31 in the record.
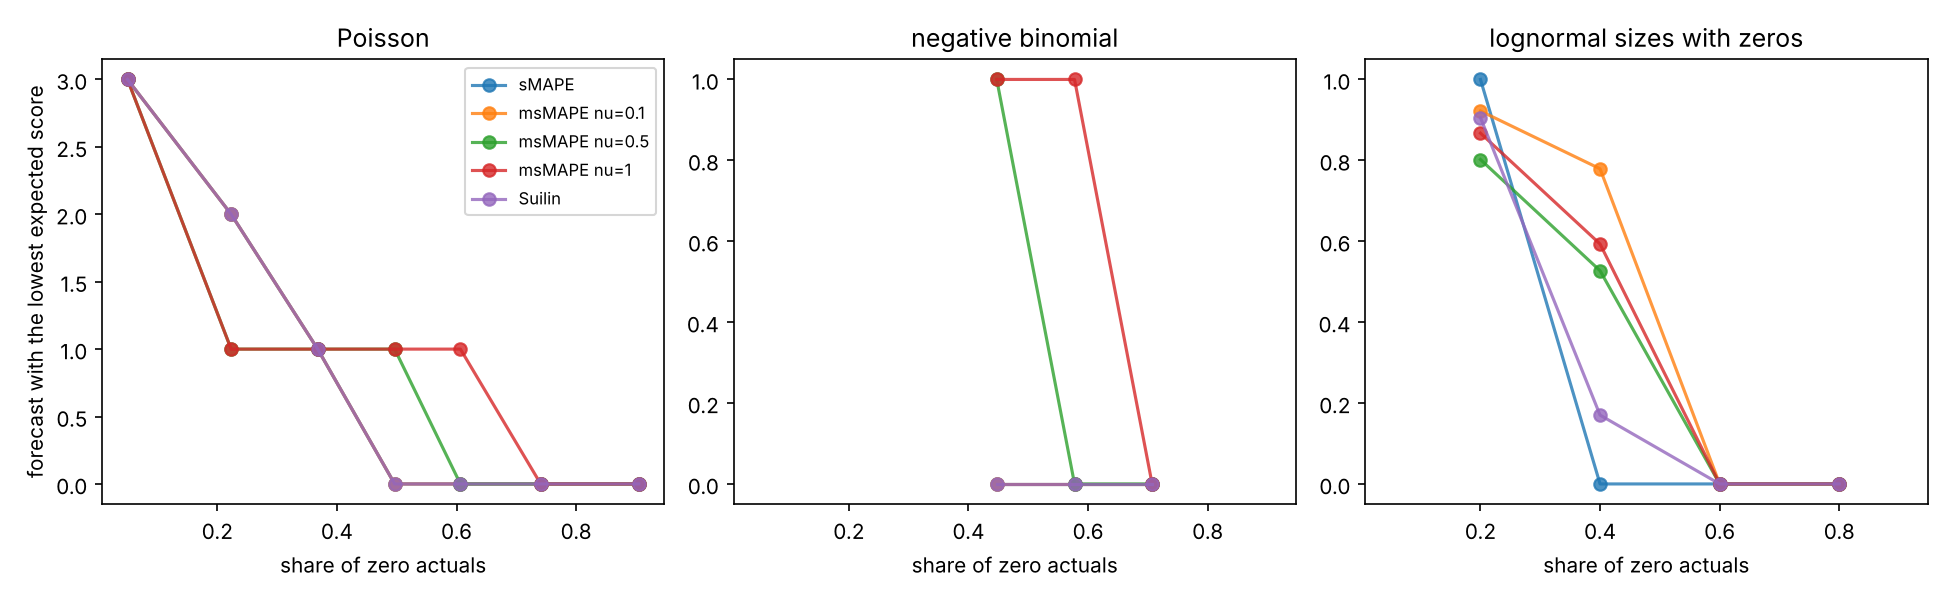
Supported by numerical check C21
Computed on intermittent demand, msMAPE needs a larger share of zeros than sMAPE before its target is 0, in line with this claim (b): a zero actual no longer gives every non-zero forecast the worst score.
Earlier work and other claims
- Extends Kolassa (2026). Kolassa (2026, Proposition 3) shows that the minimisers of expected msMAPE on counts are integers; claim C20 shows where the msMAPE term equals the sMAPE term and that it removes the jump at the zero forecast.
- Extends Smyl (2025). Smyl (2025) proposed msMAPE, the sparse-proof sMAPE, as Kolassa (2026) reports; Smyl's article was not read. Claim C20 states properties of its term as Kolassa (2026, Definition 4) defines it.
Proved · checked independently by an AI agent · tested as plannedRecord
- Claim
- C20 · formal · principal · extends earlier work
- Plan
- Test planned in lab plan PL12, recorded 18 November 2026
- Evidence
- E37, E31 in the record
- Check: confirmed
- By an AI agent (proof checking, version 3), full. Derived independently from the definition of TM38 (I did not check Kolassa's text; the check is of the statement about the term as TM38 defines it). (a) For $y\ge\nu>0$, $\max\{y,\nu\}=y$ and $p=|f-y|/(f+y)=s$ for $y,f\ge0$. So with every actual at least $\nu$ the two expected losses coincide for $f\ge0$; negative forecasts score 1 under sMAPE on positive actuals and cannot be better, so the targets agree. (b) For $y<\nu$, $p=|f-y|/(f+\nu)$; at $y=0$ it is $f/(f+\nu)=1-\nu/(f+\nu)$: 0 at $f=0$, increasing, tending to 1, whereas $s(0,f)=1$ for $f>0$. (c) $p\ge0$; for $y\ge\nu$, $p=s\le1$; for $y<\nu$, $f\ge y$ gives $f-y\le f<f+\nu$ and $f<y$ gives $y-f<\nu\le f+\nu$, so $p<1$. The denominator is at least $\nu>0$, so $p$ is continuous in $f\ge0$, and bounded convergence makes the expectation continuous. For sMAPE, $\mathrm E[s(Y,0)]=1-P(Y=0)$ while $\lim_{f\downarrow0}\mathrm E[s(Y,f)]=1$: a jump of $P(Y=0)$. (d) A count below $\nu\le1$ is 0. The proof (proof-suilin.md, second proof) matches step by step. Every part holds as worded.
- Support score
- SupportS 99 of 100. The score checks the record, not the science.
- Record
- This claim on the record page
- To cite it
- The page of this claim
Terms this claim uses
- Suilin target
- The value or values of that minimise the expected Suilin term for a given distribution of the actual: the functional the Suilin loss rewards, as the sMAPE target is the one sMAPE rewards.
- Poisson counts
- Poisson outcomes with means 0.3, 0.5, 1, 1.5, 3 and 10: counts whose share of zeros falls from 0.74 to almost 0.
Numerical check C16. The Suilin target beside the sMAPE target
Computed on actual distributions, the forecast the Suilin loss rewards is almost the same as sMAPE's away from zero and on counts. It differs near zero, where the Suilin loss needs a larger share of zeros before it rewards a zero forecast.
Computed from the distributions themselves, the Suilin target differs little from the sMAPE target away from zero and on counts, and differs near zero: it is within 0.3% of the sMAPE target on the six distributions with median about 100, and the same as the sMAPE target on every Poisson counts distribution studied; on lognormal actuals with median 1 and it is 0.985 instead of 1, and the share of zeros at which it switches to the forecast 0 is 0.470 instead of sMAPE's 0.394, while at median 100 the two shares are 0.3937 and 0.3940.
Evidence
| Row | setting | target (measure: sMAPE) | target (measure: Suilin) | quantile level of the target (measure: sMAPE) | quantile level of the target (measure: Suilin) | relative difference of the Suilin target from the sMAPE target | share of zero outcomes |
|---|---|---|---|---|---|---|---|
| r1 | lognormal sigma=0.5 | 100 | 100 | 0.5 | 0.5 | 0.0000 | 0 |
| r2 | lognormal sigma=1 | 100 | 99.98 | 0.5 | 0.4999 | -0.0002 | 0 |
| r3 | inverse Gaussian shape=10 | 14.02 | 13.98 | 0.4387 | 0.438 | -0.0027 | 0 |
| r4 | inverse Gaussian shape=100 | 66.53 | 66.52 | 0.4929 | 0.4929 | -0.0001 | 0 |
| r5 | log-skewed left sd=1 skew=-1 | 128.3 | 128.2 | 0.5362 | 0.5361 | -0.0002 | 0 |
| r6 | log-skewed right sd=1 skew=+1 | 77.96 | 77.96 | 0.4638 | 0.4638 | 0.0000 | 0 |
| r7 | lognormal median=1 sigma=1 | 1 | 0.9846 | 0.5 | 0.4938 | -0.0154 | 0 |
| r8 | lognormal median=1 sigma=1 with zeros p0=0.2 | 1 | 0.9054 | 0.6 | 0.5683 | -0.0946 | 0.2 |
| r9 | lognormal median=1 sigma=1 with zeros p0=0.4 | 0 | 0.1702 | 0.4 | 0.423 | 0.4 | |
| r10 | lognormal median=1 sigma=1 with zeros p0=0.6 | 0 | 0 | 0.6 | 0.6 | 0 | 0.6 |
| r11 | lognormal median=1 sigma=1 with zeros p0=0.8 | 0 | 0 | 0.8 | 0.8 | 0 | 0.8 |
| r12 | lognormal median=100 sigma=1 | 100 | 99.98 | 0.5 | 0.4999 | -0.0002 | 0 |
| r13 | lognormal median=100 sigma=1 with zeros p0=0.2 | 100 | 99.89 | 0.6 | 0.5997 | -0.0011 | 0.2 |
| r14 | lognormal median=100 sigma=1 with zeros p0=0.4 | 0 | 0 | 0.4 | 0.4 | 0 | 0.4 |
| r15 | lognormal median=100 sigma=1 with zeros p0=0.6 | 0 | 0 | 0.6 | 0.6 | 0 | 0.6 |
| r16 | lognormal median=100 sigma=1 with zeros p0=0.8 | 0 | 0 | 0.8 | 0.8 | 0 | 0.8 |
| r17 | Poisson mean=0.3 | 0 | 0 | 0.7408 | 0.7408 | 0 | 0.7408 |
| r18 | Poisson mean=0.5 | 0 | 0 | 0.6065 | 0.6065 | 0 | 0.6065 |
| r19 | Poisson mean=1 | 1 | 1 | 0.7358 | 0.7358 | 0 | 0.3679 |
| r20 | Poisson mean=1.5 | 2 | 2 | 0.8088 | 0.8088 | 0 | 0.2231 |
| r21 | Poisson mean=3 | 3 | 3 | 0.6472 | 0.6472 | 0 | 0.0498 |
| r22 | Poisson mean=10 | 10 | 10 | 0.583 | 0.583 | 0 | 0.0000 |
| Row | setting | zero threshold (measure: sMAPE) | zero threshold (measure: Suilin) |
|---|---|---|---|
| r1 | lognormal median=1 sigma=1 | 0.394 | 0.47 |
| r2 | lognormal median=100 sigma=1 | 0.394 | 0.3937 |
Everything recorded for this evidence: E16 in the record.
Earlier work and other claims
estimated as plannedRecord
- Claim
- C16 · descriptive · secondary · no earlier result found
- Plan
- Estimate planned in lab plan PL11, recorded 17 November 2026
- Evidence
- E16 in the record
- Scope
- data: outcome distributions given exactly (no data); conditions: positive distributions at median about 100, lognormal with zeros at medians 1 and 100, Poisson counts with means 0.3 to 10
- Support score
- SupportS 99 of 100. The score checks the record, not the science.
- Record
- This claim on the record page
Terms this claim uses
- intermittent demand settings
- Demand with many zeros. Counts: Poisson with means 0.1, 0.3, 0.5, 0.7, 1, 1.5 and 3 (share of zeros from 0.90 to 0.05) and, overdispersed, negative binomial with size 0.5 and means 0.5, 1 and 2 (share of zeros 0.71, 0.58 and 0.45). Non-integer demand: lognormal demand sizes (median 1, ) replaced by 0 with probability 0.2, 0.4, 0.6 or 0.8.
- msMAPE target
- The value or values of that minimise the expected msMAPE term for a given distribution of the actual and a given constant : the functional msMAPE rewards, as the sMAPE target is the one sMAPE rewards.
Numerical check C21. What msMAPE rewards on intermittent demand
On counts, msMAPE with ν = 0.1 and the Suilin loss reward the same forecast as sMAPE. With ν = 0.5 or 1 it is 0 less often. On non-integer demand the zero forecast needs a larger share of zeros: sMAPE 0.394; msMAPE 0.419, 0.519, 0.565; Suilin 0.470.
The forecasts that sMAPE, msMAPE with , 0.5 and 1, and the Suilin loss reward were computed from the distributions themselves on the 14 intermittent demand settings.
- (a)On each of the 10 count distributions, the msMAPE target with and the Suilin target equal the sMAPE target. With the msMAPE target is 1 instead of 0 on Poisson counts with mean 0.7 and on negative binomial counts with mean 2, and 1 instead of 2 on Poisson counts with mean 1.5. With it is also 1 instead of 0 on Poisson counts with mean 0.5 and on negative binomial counts with mean 1.
- (b)For lognormal demand sizes with zeros, the share of zeros at which the target switches to the forecast 0 is 0.394 for sMAPE, 0.419 for msMAPE with , 0.470 for the Suilin loss, 0.519 for msMAPE with and 0.565 with .
- (c)In test sets of 12, 52 and 365 actuals, the forecast with the lowest score is 0 no more often under msMAPE than under sMAPE, and no more often under a larger . With 52 actuals from Poisson counts with mean 0.7, it is 0 in 0.6575 of the test sets under sMAPE, 0.523 with , 0.1525 with and 0.0265 with .
Evidence
| Row | setting | share of zero outcomes | median of the outcomes | mode of the outcomes | mean of the outcomes | target (measure: sMAPE) | target (measure: msMAPE nu=0.1) | target (measure: msMAPE nu=0.5) | target (measure: msMAPE nu=1) | target (measure: Suilin) |
|---|---|---|---|---|---|---|---|---|---|---|
| r1 | Poisson mean=0.1 | 0.9048 | 0 | 0 | 0.1 | 0 | 0 | 0 | 0 | 0 |
| r2 | Poisson mean=0.3 | 0.7408 | 0 | 0 | 0.3 | 0 | 0 | 0 | 0 | 0 |
| r3 | Poisson mean=0.5 | 0.6065 | 0 | 0 | 0.5 | 0 | 0 | 0 | 1 | 0 |
| r4 | Poisson mean=0.7 | 0.4966 | 1 | 0 | 0.7 | 0 | 0 | 1 | 1 | 0 |
| r5 | Poisson mean=1 | 0.3679 | 1 | 0 | 1 | 1 | 1 | 1 | 1 | 1 |
| r6 | Poisson mean=1.5 | 0.2231 | 1 | 1 | 1.5 | 2 | 2 | 1 | 1 | 2 |
| r7 | Poisson mean=3 | 0.0498 | 3 | 2 | 3 | 3 | 3 | 3 | 3 | 3 |
| r8 | negative binomial mean=0.5 size=0.5 | 0.7071 | 0 | 0 | 0.5 | 0 | 0 | 0 | 0 | 0 |
| r9 | negative binomial mean=1 size=0.5 | 0.5774 | 0 | 0 | 1 | 0 | 0 | 0 | 1 | 0 |
| r10 | negative binomial mean=2 size=0.5 | 0.4472 | 1 | 0 | 2 | 0 | 0 | 1 | 1 | 0 |
| r11 | lognormal sizes with zeros p0=0.2 | 0.2 | 0.7271 | 1.319 | 1 | 0.922 | 0.8021 | 0.8672 | 0.9054 | |
| r12 | lognormal sizes with zeros p0=0.4 | 0.4 | 0.3801 | 0.9892 | 0 | 0.7791 | 0.5271 | 0.5932 | 0.1702 | |
| r13 | lognormal sizes with zeros p0=0.6 | 0.6 | 0 | 0.6595 | 0 | 0 | 0 | 0 | 0 | |
| r14 | lognormal sizes with zeros p0=0.8 | 0.8 | 0 | 0.3297 | 0 | 0 | 0 | 0 | 0 |
| Row | setting | zero threshold (measure: sMAPE) | zero threshold (measure: msMAPE nu=0.1) | zero threshold (measure: msMAPE nu=0.5) | zero threshold (measure: msMAPE nu=1) | zero threshold (measure: Suilin) |
|---|---|---|---|---|---|---|
| r1 | lognormal sizes with zeros | 0.394 | 0.4191 | 0.5192 | 0.5647 | 0.47 |
| Row | setting | n | share of test sets whose minimiser is 0 (measure: sMAPE) | share of test sets whose minimiser is 0 (measure: msMAPE nu=0.1) | share of test sets whose minimiser is 0 (measure: msMAPE nu=0.5) | share of test sets whose minimiser is 0 (measure: msMAPE nu=1) | share of test sets whose minimiser is 0 (measure: Suilin) |
|---|---|---|---|---|---|---|---|
| r1 | Poisson mean=0.1 | 12 | 1 | 0.9995 | 0.996 | 0.975 | 1 |
| r2 | Poisson mean=0.1 | 52 | 1 | 1 | 1 | 1 | 1 |
| r3 | Poisson mean=0.1 | 365 | 1 | 1 | 1 | 1 | 1 |
| r4 | Poisson mean=0.3 | 12 | 0.979 | 0.937 | 0.831 | 0.7145 | 0.979 |
| r5 | Poisson mean=0.3 | 52 | 1 | 1 | 0.9915 | 0.9155 | 1 |
| r6 | Poisson mean=0.3 | 365 | 1 | 1 | 1 | 0.9995 | 1 |
| r7 | Poisson mean=0.5 | 12 | 0.848 | 0.7525 | 0.539 | 0.378 | 0.848 |
| r8 | Poisson mean=0.5 | 52 | 0.9685 | 0.923 | 0.6515 | 0.288 | 0.966 |
| r9 | Poisson mean=0.5 | 365 | 1 | 1 | 0.8445 | 0.067 | 1 |
| r10 | Poisson mean=0.7 | 12 | 0.6045 | 0.515 | 0.2915 | 0.1555 | 0.6045 |
| r11 | Poisson mean=0.7 | 52 | 0.6575 | 0.523 | 0.1525 | 0.0265 | 0.6455 |
| r12 | Poisson mean=0.7 | 365 | 0.844 | 0.56 | 0.0025 | 0 | 0.8295 |
| r13 | Poisson mean=1 | 12 | 0.256 | 0.2265 | 0.0895 | 0.037 | 0.256 |
| r14 | Poisson mean=1 | 52 | 0.1015 | 0.051 | 0.003 | 0 | 0.1 |
| r15 | Poisson mean=1 | 365 | 0 | 0 | 0 | 0 | 0 |
| r16 | Poisson mean=1.5 | 12 | 0.0325 | 0.03 | 0.0075 | 0.002 | 0.0325 |
| r17 | Poisson mean=1.5 | 52 | 0.0005 | 0.0005 | 0 | 0 | 0.0005 |
| r18 | Poisson mean=1.5 | 365 | 0 | 0 | 0 | 0 | 0 |
| r19 | Poisson mean=3 | 12 | 0 | 0 | 0 | 0 | 0 |
| r20 | Poisson mean=3 | 52 | 0 | 0 | 0 | 0 | 0 |
| r21 | Poisson mean=3 | 365 | 0 | 0 | 0 | 0 | 0 |
| r22 | negative binomial mean=0.5 size=0.5 | 12 | 0.971 | 0.952 | 0.857 | 0.721 | 0.9705 |
| r23 | negative binomial mean=0.5 size=0.5 | 52 | 1 | 1 | 0.9895 | 0.9095 | 1 |
| r24 | negative binomial mean=0.5 size=0.5 | 365 | 1 | 1 | 1 | 1 | 1 |
| r25 | negative binomial mean=1 size=0.5 | 12 | 0.8035 | 0.78 | 0.621 | 0.4435 | 0.808 |
| r26 | negative binomial mean=1 size=0.5 | 52 | 0.975 | 0.9625 | 0.7675 | 0.405 | 0.974 |
| r27 | negative binomial mean=1 size=0.5 | 365 | 1 | 1 | 0.975 | 0.256 | 1 |
| r28 | negative binomial mean=2 size=0.5 | 12 | 0.567 | 0.5265 | 0.384 | 0.2405 | 0.5765 |
| r29 | negative binomial mean=2 size=0.5 | 52 | 0.707 | 0.635 | 0.3055 | 0.068 | 0.7255 |
| r30 | negative binomial mean=2 size=0.5 | 365 | 0.932 | 0.8475 | 0.1115 | 0 | 0.9475 |
| r31 | lognormal sizes with zeros p0=0.2 | 12 | 0.046 | 0.026 | 0.0055 | 0.002 | 0.016 |
| r32 | lognormal sizes with zeros p0=0.2 | 52 | 0 | 0 | 0 | 0 | 0 |
| r33 | lognormal sizes with zeros p0=0.2 | 365 | 0 | 0 | 0 | 0 | 0 |
| r34 | lognormal sizes with zeros p0=0.4 | 12 | 0.4655 | 0.374 | 0.1735 | 0.119 | 0.303 |
| r35 | lognormal sizes with zeros p0=0.4 | 52 | 0.5235 | 0.36 | 0.045 | 0.012 | 0.172 |
| r36 | lognormal sizes with zeros p0=0.4 | 365 | 0.5665 | 0.207 | 0 | 0 | 0.004 |
| r37 | lognormal sizes with zeros p0=0.6 | 12 | 0.896 | 0.8565 | 0.663 | 0.5805 | 0.8055 |
| r38 | lognormal sizes with zeros p0=0.6 | 52 | 0.9975 | 0.993 | 0.844 | 0.6765 | 0.9705 |
| r39 | lognormal sizes with zeros p0=0.6 | 365 | 1 | 1 | 0.999 | 0.892 | 1 |
| r40 | lognormal sizes with zeros p0=0.8 | 12 | 0.9975 | 0.9955 | 0.9725 | 0.959 | 0.991 |
| r41 | lognormal sizes with zeros p0=0.8 | 52 | 1 | 1 | 1 | 0.9995 | 1 |
| r42 | lognormal sizes with zeros p0=0.8 | 365 | 1 | 1 | 1 | 1 | 1 |
Everything recorded for this evidence: E34 in the record.
Earlier work and other claims
estimated as plannedRecord
- Claim
- C21 · descriptive · secondary · no earlier result found
- Plan
- Estimate planned in lab plan PL14, recorded 18 November 2026
- Evidence
- E34 in the record
- Scope
- data: outcome distributions given exactly, and test sets drawn from them; conditions: 14 settings: 10 count distributions (Poisson with means 0.1 to 3, negative binomial with size 0.5 and means 0.5 to 2) and lognormal demand sizes (median 1, sigma 1) with shares of zeros 0.2 to 0.8, msMAPE with nu = 0.1, 0.5 and 1, test sets of 12, 52 and 365 independent actuals, 2000 test sets per setting and size
- Support score
- SupportS 97 of 100. The score checks the record, not the science.
- Record
- This claim on the record page
Precision on a test set
Terms this claim uses
- log-symmetric outcomes
- Lognormal outcomes with , and log-Laplace outcomes with scale , each 0.25, 0.5, 1, 1.5, 2, 3, 4 or 6, median 100: symmetric and strictly unimodal, so that sMAPE and MAE both target the median (claim C5).
- sMAPE minimiser of a test set
- The forecast that minimises the sMAPE of one test set , , found numerically (the sample counterpart of the sMAPE target).
- relative efficiency
- For a test-set size and an outcome distribution where sMAPE and MAE both target the median: over test sets, where is the sample median (the MAE minimiser) and the sMAPE minimiser of the same test set. Above 1, sMAPE's minimiser varies less; below 1, MAE's does.
Claim C15. sMAPE finds the median less precisely than the sample median
Even where sMAPE and MAE both reward the median, the forecast that minimises sMAPE on a test set varies more than the sample median. The loss of precision grows as the data spread out.
Where sMAPE and MAE both target the median (log-symmetric outcomes), the sMAPE minimiser of a test set varies more than the sample median for every spread and test-set size studied: its relative efficiency is below 1 and falls as the actuals spread out, at from 0.97 to 0.03 on lognormal actuals as grows from 0.25 to 6, and from 1.00 to 0.34 on log-Laplace actuals as grows from 0.25 to 6, close to the large-sample values.
Evidence
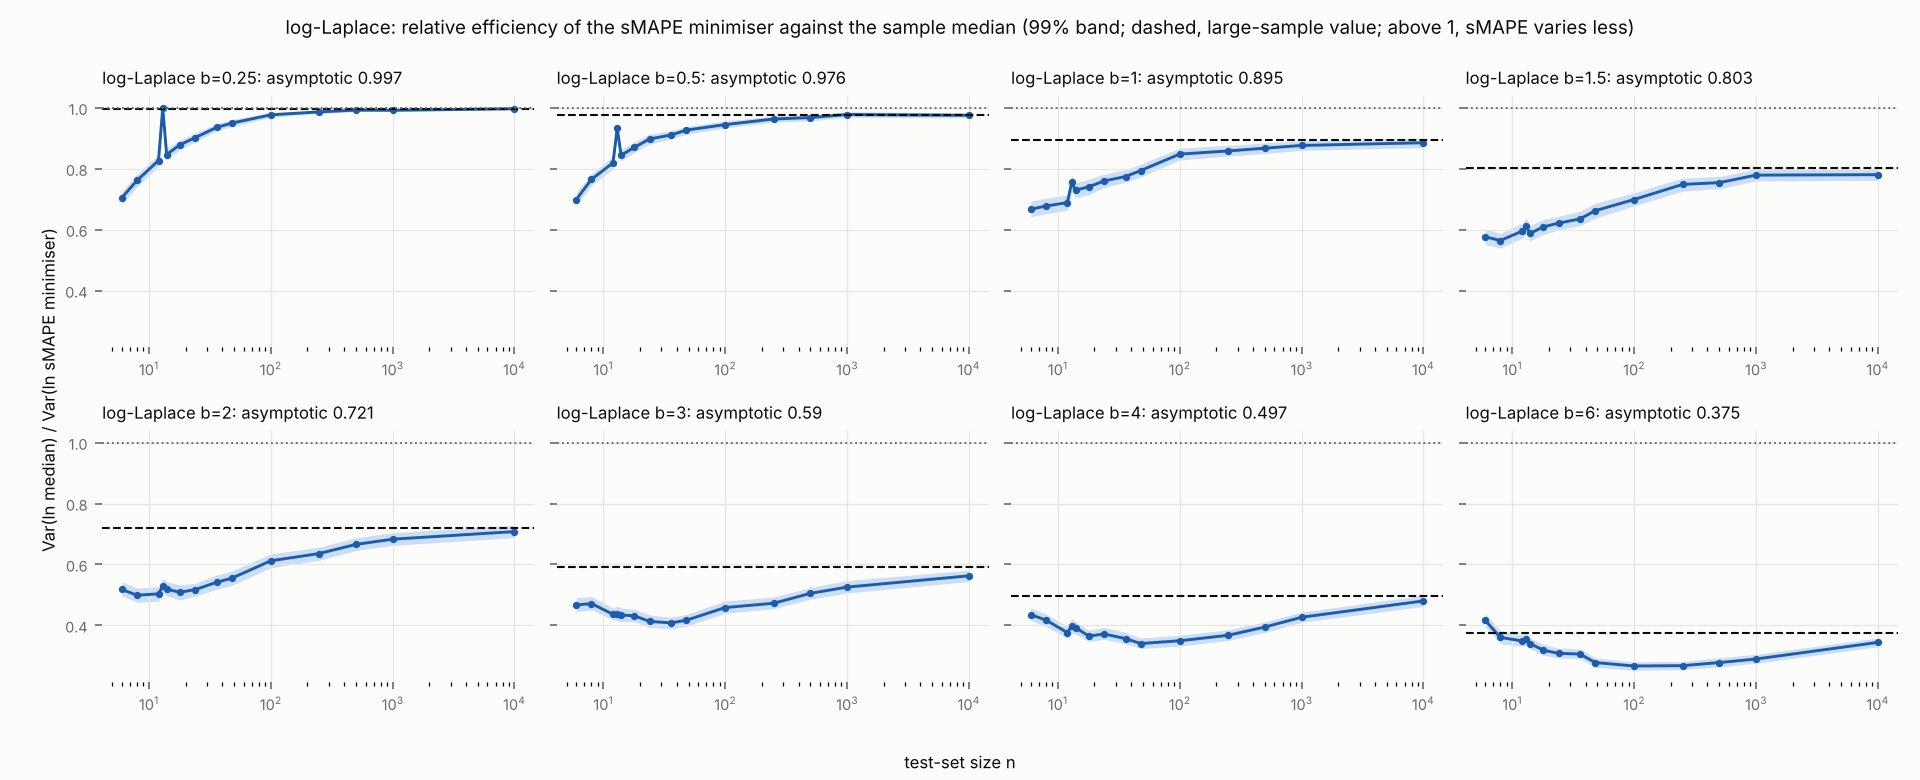
| Row | setting | relative efficiency (test-set size: 6) | relative efficiency (test-set size: 12) | relative efficiency (test-set size: 100) | relative efficiency (test-set size: 1000) | relative efficiency (test-set size: 10000) | asymptotic relative efficiency |
|---|---|---|---|---|---|---|---|
| r1 | lognormal sigma=0.25 | 0.6059 | 0.7026 | 0.8996 | 0.9662 | 0.9701 | 0.9696 |
| r2 | lognormal sigma=0.5 | 0.611 | 0.7083 | 0.8802 | 0.885 | 0.8906 | 0.8881 |
| r3 | lognormal sigma=1 | 0.6067 | 0.6555 | 0.6524 | 0.6659 | 0.6565 | 0.6601 |
| r4 | lognormal sigma=1.5 | 0.5484 | 0.5123 | 0.4595 | 0.4633 | 0.45 | 0.454 |
| r5 | lognormal sigma=2 | 0.501 | 0.4392 | 0.323 | 0.3077 | 0.3043 | 0.3073 |
| r6 | lognormal sigma=3 | 0.4381 | 0.3646 | 0.2058 | 0.1557 | 0.1513 | 0.1474 |
| r7 | lognormal sigma=4 | 0.4148 | 0.3272 | 0.1561 | 0.089 | 0.0789 | 0.0778 |
| r8 | lognormal sigma=6 | 0.3933 | 0.3027 | 0.1229 | 0.0508 | 0.0317 | 0.0279 |
| r9 | log-Laplace b=0.25 | 0.7049 | 0.8268 | 0.9769 | 0.9918 | 0.9969 | 0.9969 |
| r10 | log-Laplace b=0.5 | 0.6989 | 0.819 | 0.9448 | 0.9779 | 0.9753 | 0.9765 |
| r11 | log-Laplace b=1 | 0.667 | 0.6887 | 0.8479 | 0.8763 | 0.8853 | 0.8953 |
| r12 | log-Laplace b=1.5 | 0.5766 | 0.5947 | 0.6989 | 0.7789 | 0.7804 | 0.8035 |
| r13 | log-Laplace b=2 | 0.5179 | 0.5036 | 0.612 | 0.683 | 0.7079 | 0.7206 |
| r14 | log-Laplace b=3 | 0.4672 | 0.4365 | 0.4586 | 0.5257 | 0.5628 | 0.5902 |
| r15 | log-Laplace b=4 | 0.4353 | 0.3764 | 0.3496 | 0.4267 | 0.4803 | 0.4968 |
| r16 | log-Laplace b=6 | 0.4167 | 0.3492 | 0.2667 | 0.2896 | 0.3441 | 0.3753 |
Everything recorded for this evidence: E15 in the record.
Explained by claim C19
This claim found by simulation that the sMAPE minimiser of a test set varies more than the sample median, the more so the wider the spread. Claim C19 gives the limiting variances of both and the rates at which their ratio falls.
Earlier work and other claims
- Supports Svetunkov (2026b), C11. C11 found sMAPE's choices in short test sets spreading more than MAE's; claim C15 measures the loss of precision for test sets of 6 to 10000 outcomes.
- Supports Svetunkov (2026a), C6. C6 recommends against sMAPE for point forecasts; claim C15 shows that even where it targets the median it estimates it less precisely than the sample median.
- Supports Kolassa (2026). Kolassa (2026) concludes that sMAPE should not be used; claim C15 shows that even where it targets the median it estimates it less precisely than the sample median.
- Qualifies claim C12. Where claim C12 makes the median the target, the forecast that minimises sMAPE on a test set finds it less precisely than the sample median.
estimated as plannedRecord
- Claim
- C15 · descriptive · principal · no earlier result found
- Plan
- Estimate planned in lab plan PL2, recorded 16 November 2026
- Evidence
- E15 in the record
- Scope
- data: test sets of independent draws from known distributions; conditions: lognormal and log-Laplace outcomes, spread 0.25 to 6, test sets of 6 to 10000 outcomes
- Limitations
- L2
- Support score
- SupportS 89 of 100. The score checks the record, not the science.
- Record
- This claim on the record page
- To cite it
- The page of this claim
Claim C19. The sMAPE minimiser in large samples
Where the log of the actual is symmetric with one peak, the forecast that minimises sMAPE on a test set is asymptotically normal about the median. It is asymptotically as precise as the sample median for narrow distributions and loses its precision as the actuals spread out.
Let have a density that is symmetric about , unimodal ( whenever , strictly on a set of positive probability) and continuous at . Write , and .
- (a).
- (b)Over test sets of independent actuals, the sMAPE minimiser of a test set (a forecast with the lowest sMAPE of the test set) tends to in probability, and is asymptotically normal with mean 0 and variance ; for the sample median the variance is . The ratio of these two limiting variances, the asymptotic relative efficiency of the sMAPE minimiser to the sample median, is that the relative efficiency of finite test sets tends to it is not shown here, since the variances of finite test sets need not tend to those of the limits.
- (c)For lognormal actuals with standard deviation of : as and as . For log-Laplace actuals with scale of : as and as . So on both families the sMAPE minimiser is asymptotically as precise as the sample median for narrow distributions and asymptotically loses all of its precision relative to it as the actuals spread out.
Proof 14 steps
- Write for the actuals of a test set and for a forecast . By claim C3 the mean sMAPE term of the test set is , and its expectation is . So minimises ; a minimiser exists, because is continuous, tends to 1 as grows, and is below 1 at each .
- (a). Write . Since is the derivative of for , . By unimodality , so . A density cannot equal everywhere, and does not increase as grows; so for every beyond some point, where . So the inequality is strict.
- The expected loss is lowest at 0 only. is the expected sMAPE term of the forecast . By claim C5, for every . The function has slope at most , so and every change by at most between and ; in particular is continuous. And as , by bounded convergence. So for every the lowest value of over is above .
- is close to for all at once. For each , with probability 1 (law of large numbers; the terms are bounded). Take a grid of spacing on : by the slope bound of step 3, once is within of at the grid points it is within of on all of . Outside : an actual with has when , so is at least times the share of such actuals, which tends to . Since , for large this is above by a fixed margin.
- Consistency. , which tends to . By step 4, with probability tending to 1, and is within any given margin of ; by step 3, . So in probability, which is . This is the argument of van der Vaart (1998, Theorem 5.7).
- The curvature at 0. By claim C12, step 4, with , the second derivative of at 0 is , which is positive by step 2. The first derivative at 0 is 0, because 0 is the minimum (step 3).
- Asymptotic normality. For every , has a derivative at , with for and for ; and has probability zero. For every it changes by at most (step 3). has a second-order expansion at its minimum 0 with a positive second derivative (step 6). And minimises and tends to 0 in probability (step 5). These are the conditions of the theorem on estimators that minimise a criterion which is Lipschitz in the parameter (van der Vaart, 1998, Theorem 5.23). It gives that is asymptotically normal with mean 0 and variance divided by the square of the second derivative of at 0.
- The variance. , and the square of the second derivative is (step 6). So the variance is .
- The sample median. The logarithm of the sample median of the is the sample median of the , which minimises the mean of . The same theorem applies with in place of : the derivative at 0 is for and for , with square 1; the criterion changes by at most ; and the second derivative of at 0 is , positive because is largest at . So the variance is .
- (b), the ratio. Dividing the variance of step 9 by that of step 8 gives .
- (c), narrow distributions. Write with standard normal, or Laplace with scale 1 and ; then with the density of , and . As , and by bounded convergence, and . So .
- (c), wide lognormal distributions. Since (step 2), . For the normal density, , and . Integrating by parts, ; and is finite. So . In the same way, with , . With , tends to .
- (c), wide log-Laplace distributions. Here , so , which lies between and . Integrating by parts, . So , and in the same way . With , tends to .
So the sMAPE minimiser of a test set is asymptotically normal about the median, with a variance that the density at the median and two expectations give. On lognormal and log-Laplace actuals it is asymptotically as precise as the sample median for narrow distributions and asymptotically loses all of its precision relative to it as the actuals spread out, at the rates and . ∎
Rests on Vaart (1998), Theorems 5.7 and 5.23
Its formulae were also checked on numbers: E33 in the record.
Earlier work and other claims
Proved · checked independently by an AI agent · tested as plannedRecord
- Claim
- C19 · formal · principal · no earlier result found
- Plan
- Test planned in lab plan PL15, recorded 18 November 2026
- Evidence
- E36, E33 in the record
- Check: disputed
- By an AI agent (proof checking, version 3), full. Derived independently, with $x=\ln Y-\ln m$, $\theta=\ln f-\ln m$, $M(\theta)=\mathrm E\tanh(|x-\theta|/2)$. (a) $k(u)=\operatorname{sech}^2(u/2)\tanh(|u|/2)$ is positive for $u\ne0$ with $\int k=2$, and $g(\ln m+u)\le g(\ln m)$ with strict inequality on a set of positive Lebesgue measure (a density cannot be constant on the whole line), so $A<2g(\ln m)$ strictly. This holds even without the "positive probability" clause (e.g. for a uniform $g$), so the hypothesis is stronger than needed. (b) Consistency: the proof's direct argument (step 3: a grid on $[-R,R]$ plus the $\tfrac12$-Lipschitz bound; outside, $M_n\ge\tanh(R/4)P_n(|x|\le R/2)$) is valid. A minimiser of $M_n$ exists because $M_n$ is continuous, tends to 1 at $\pm\infty$ and is below 1 at any data point; this is not stated. van der Vaart Thm 5.23 conditions: $|m_{\theta_1}-m_{\theta_2}|\le\tfrac12|\theta_1-\theta_2|$ (constant, square integrable); differentiable at 0 for every $x\ne0$; second-order expansion $M(\theta)=M(0)+\tfrac12V\theta^2+o(\theta^2)$ with $V=g(\ln m)-A/2>0$. I re-derived H12 step 4: writing the kernel as $-\operatorname{sign}+\operatorname{sign}\cdot\tanh^2$, $M'$ exists everywhere and is differentiable at 0 with $M''(0)=g(\ln m)-A/2$ whenever $g$ is continuous at $\ln m$, and $M(\theta)-M(0)=\int_0^\theta M'$ gives the expansion. So continuity at $\ln m$ suffices. Variance $(B/4)/(V^2)=B/(2g-A)^2$; sample median $1/(4g^2)$; ratio $(2g-A)^2/(4g^2B)$: all correct. (c) Recomputed: $\int u^2k=16\ln2$, $\int\operatorname{sech}^4(u/2)=8/3$, $\int|u|k=4$; lognormal $\mathrm{ARE}\,\sigma^3\to6(\ln2)^2\sqrt{2\pi}\approx7.226$ with relative error $O(\sigma^{-2})$; log-Laplace $2g-A=2/b^2+O(b^{-3})$, $B=4/(3b)+O(b^{-2})$, so $\mathrm{ARE}\,b=3+O(1/b)$ (the proof's orders are right; quadrature gives $b(\mathrm{ARE}\,b-3)\approx-5.6$). Both narrow limits are 1. Quadrature agrees with all four limits. The one statement I cannot confirm as worded is the appositive in (b): "The ratio of the two, the large-sample value of the [[TM9:relative efficiency]], is ARE". TM9 defines $\mathrm{RE}(n)$ as a ratio of finite-sample variances, so its "large-sample value" reads as $\lim_n\mathrm{RE}(n)$. The proof establishes only the ratio of the variances of the limiting normal distributions. Convergence in distribution does not give convergence of $n\operatorname{Var}$, and under the hypotheses of H40 the limit can fail. For example, a symmetric, decreasing, continuous $g$ with $P(|x|>t)\sim1/\ln t$ makes the sample median's variance infinite for every $n$, so $\mathrm{RE}(n)$ never approaches the finite ARE. For lognormal and log-Laplace actuals the identification is very likely true, but it would need a uniform-integrability argument that is not given. Suggested wording: "The ratio of the two asymptotic variances, the asymptotic relative efficiency (the ratio of the variances of the limiting distributions; it is the limit of the relative efficiency only where $n$ times each estimator's variance converges to its asymptotic variance, which is not shown here), is ARE = ...". The closing "as precise as ... loses all of its precision" should then say "asymptotically". With that rewording I would confirm every part. The statement was corrected, and the checker confirmed the corrected wording in a later check listed here.
- Check: confirmed
- By an AI agent (proof checking, version 3), full. Re-checked every part as now worded, against the revised H14. (a): $\int k=2$, $k>0$ off 0, and $g(\ln m+u)<g(\ln m)$ on a set of positive measure, so $A<2g(\ln m)$ strictly. (b): a minimiser of $M_n$ exists (now stated in the proof: $M_n$ is continuous, tends to 1 at both ends, and is below 1 at each $x_t$). The consistency argument (grid on $[-R,R]$, Lipschitz $\tfrac12$, lower bound outside) is valid. The conditions of van der Vaart Thm 5.23 hold: constant Lipschitz bound $\tfrac12$; differentiability at 0 for $x\ne0$; second-order expansion with $M''(0)=g(\ln m)-A/2>0$, which exists under continuity of $g$ at $\ln m$ by the decomposition now in H12 step 4. The asymptotic variances are $B/(2g-A)^2$ and $1/(4g^2)$, and their ratio is the stated ARE. The corrected sentence now calls this the asymptotic relative efficiency and says explicitly that convergence of the finite-sample relative efficiency (TM9) to it is not shown; that is exactly what the proof establishes. (c): recomputed $\int u^2k=16\ln2$, $\int\operatorname{sech}^4(u/2)=8/3$, $\int|u|k=4$. The limits $\mathrm{ARE}\to1$ (both narrow cases), $\mathrm{ARE}\,\sigma^3\to6(\ln2)^2\sqrt{2\pi}\approx7.226$ and $\mathrm{ARE}\,b\to3$ check by hand and by quadrature. The remainder orders in steps 11–12 are right (the log-Laplace one is a relative $O(1/b)$). The closing sentence, now with "asymptotically", follows from (c). Every part holds as worded and the proof establishes it.
- Support score
- SupportS 100 of 100. The score checks the record, not the science.
- Record
- This claim on the record page
- To cite it
- The page of this claim
Numerical checks
Numerical check C13. The sMAPE target on 34 distributions
Computed on 34 distributions, the forecast sMAPE rewards is the median on lognormal data. It moves away from the median on skewed data, sits near a mode on two-group data, and becomes zero once enough of the data are zeros, always fewer than half.
Computed from the distributions themselves, the sMAPE target on the 34 outcome distributions of plan PL1 is the median on lognormal outcomes, lies below it when is skewed right and above it when skewed left (quantile levels from 0.439 to 0.556 on the unimodal positive distributions), is two forecasts, one near each mode, on equal bimodal outcomes and the larger mode's on unequal ones, lies away from zero on the side of the mean on normal outcomes straddling zero, and switches to 0 at shares of zero outcomes from 0.343 to 0.468, all below one half. On test sets the forecast sMAPE ranks first spreads widely when they are small: on lognormal outcomes with , its quantile level runs from 0.16 to 0.82 (5th to 95th percentile over test sets) with 6 outcomes and from 0.47 to 0.53 with 1000.
Evidence
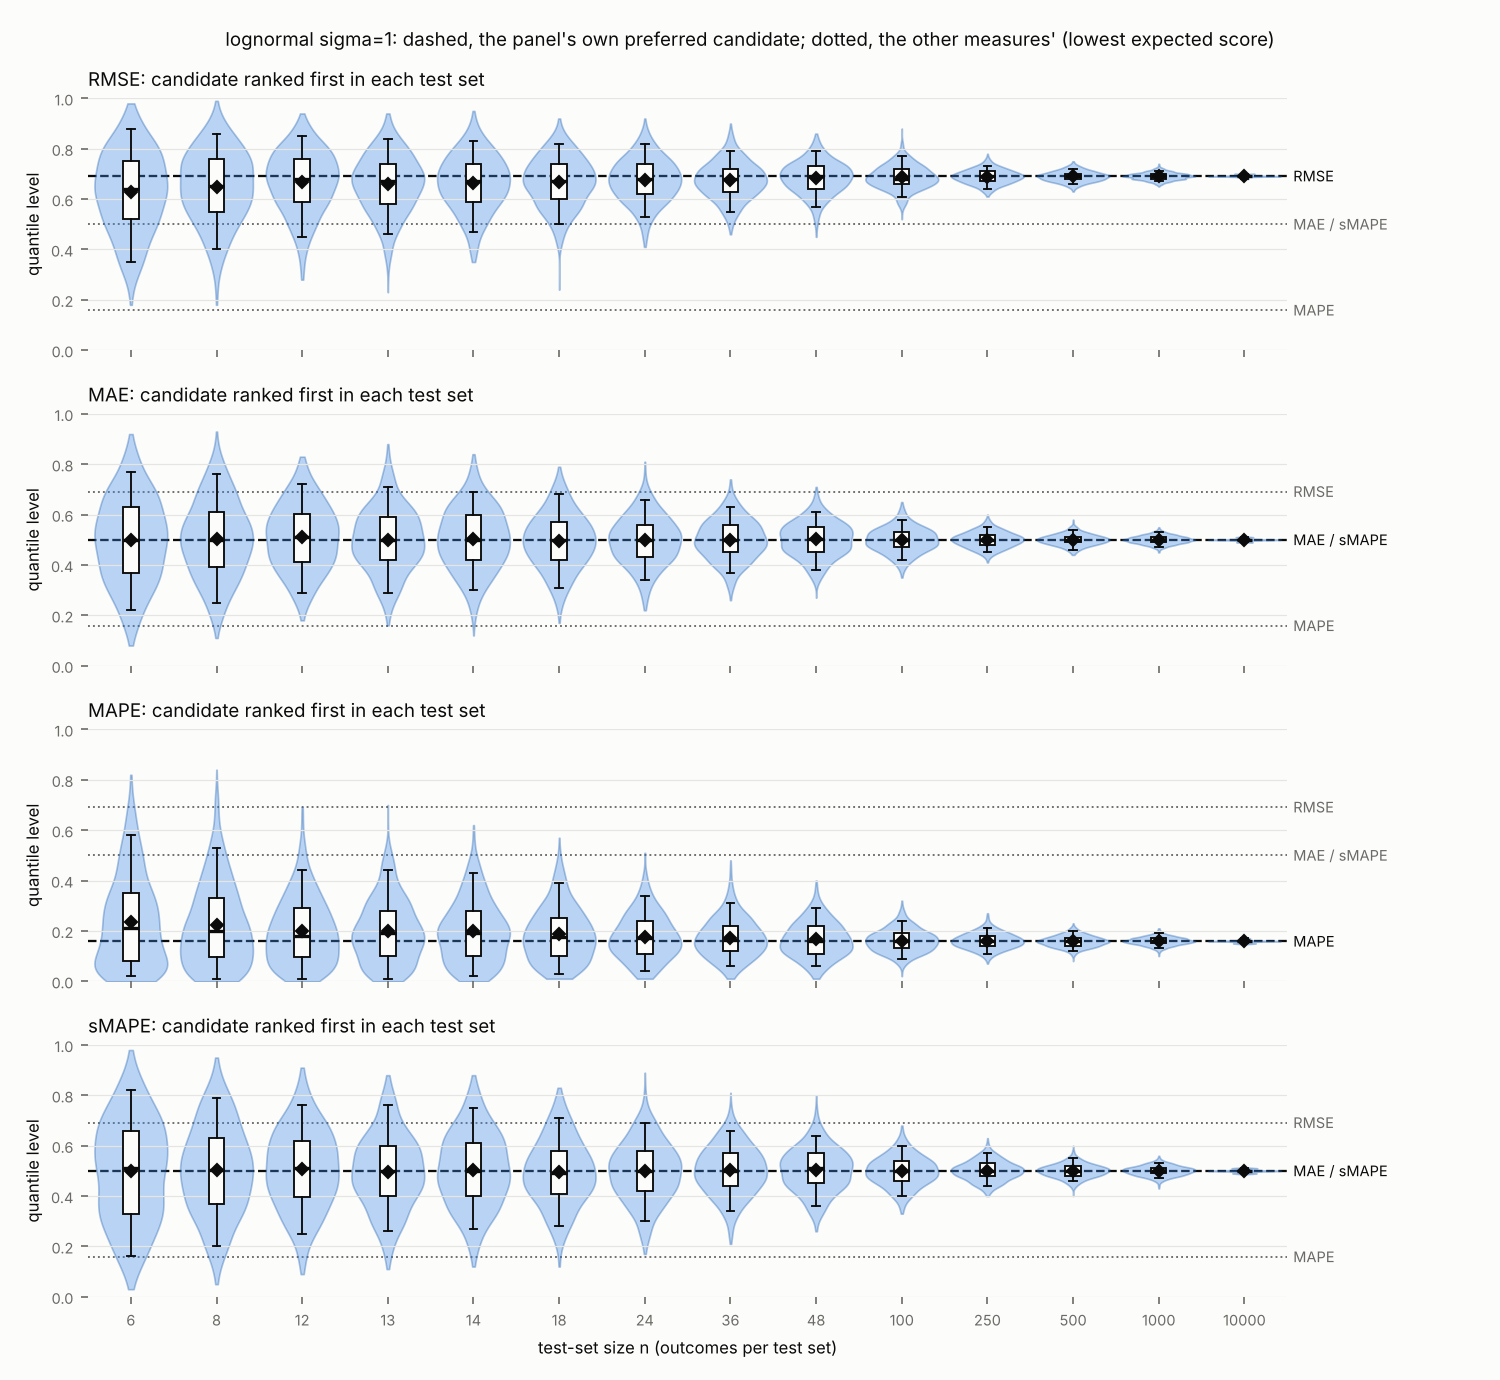
| Row | setting | derived local minimum of expected sMAPE (rank: 1) | quantile level of a derived local minimum of expected sMAPE (rank: 1) | expected sMAPE at a derived local minimum (rank: 1) | one-step quantile level of the sMAPE target | pull from above minus pull from below at the median | zero threshold of sMAPE | quantile level of the log-mode | median of the outcome distribution | mean of the outcome distribution |
|---|---|---|---|---|---|---|---|---|---|---|
| r1 | inverse Gaussian shape=1000 | 95.27 | 0.4999 | 24.36 | 0.4999 | -0.0001 | 0.4676 | 0.498 | 95.27 | 100 |
| r2 | inverse Gaussian shape=200 | 80.14 | 0.4978 | 48.68 | 0.4978 | -0.0019 | 0.4307 | 0.4822 | 80.43 | 100 |
| r3 | inverse Gaussian shape=100 | 66.53 | 0.4929 | 61.97 | 0.4929 | -0.0052 | 0.4083 | 0.4597 | 67.58 | 100 |
| r4 | inverse Gaussian shape=50 | 48.86 | 0.482 | 75.05 | 0.482 | -0.0114 | 0.3845 | 0.4233 | 51.42 | 100 |
| r5 | inverse Gaussian shape=20 | 25.9 | 0.4578 | 88.96 | 0.457 | -0.0224 | 0.357 | 0.3726 | 30.11 | 100 |
| r6 | inverse Gaussian shape=10 | 14.02 | 0.4387 | 95.75 | 0.4362 | -0.03 | 0.3426 | 0.3471 | 17.85 | 100 |
| r7 | log-skewed left sd=0.5 skew=-2 | 119 | 0.5211 | 32.31 | 0.5211 | 0.0197 | 0.4561 | 1 | 116.6 | 109.9 |
| r8 | log-skewed left sd=0.5 skew=-1 | 110.2 | 0.513 | 36.74 | 0.513 | 0.0117 | 0.4494 | 0.6472 | 108.5 | 111.3 |
| r9 | log-skewed left sd=0.5 skew=-0.5 | 105.1 | 0.5068 | 37.96 | 0.5068 | 0.0061 | 0.4476 | 0.5681 | 104.2 | 112.2 |
| r10 | log-skewed right sd=0.5 skew=+2 | 84.02 | 0.4789 | 32.31 | 0.4789 | -0.0197 | 0.4561 | 0 | 85.78 | 121.3 |
| r11 | log-skewed right sd=0.5 skew=+1 | 90.72 | 0.487 | 36.74 | 0.487 | -0.0117 | 0.4494 | 0.3528 | 92.13 | 116.3 |
| r12 | log-skewed right sd=0.5 skew=+0.5 | 95.13 | 0.4932 | 37.96 | 0.4932 | -0.0061 | 0.4476 | 0.4319 | 95.93 | 114.6 |
| r13 | lognormal sigma=0.5 | 100 | 0.5 | 38.38 | 0.5 | 0.0000 | 0.4469 | 0.5 | 100 | 113.3 |
| r14 | log-skewed left sd=1 skew=-2 | 151.2 | 0.5562 | 57.04 | 0.5572 | 0.0456 | 0.4168 | 1 | 135.9 | 135.9 |
| r15 | log-skewed left sd=1 skew=-1 | 128.3 | 0.5362 | 66.42 | 0.5365 | 0.0261 | 0.4004 | 0.6472 | 117.8 | 146 |
| r16 | log-skewed left sd=1 skew=-0.5 | 113.9 | 0.5191 | 69.05 | 0.5192 | 0.0133 | 0.3957 | 0.5681 | 108.7 | 153.7 |
| r17 | log-skewed right sd=1 skew=+2 | 66.14 | 0.4438 | 57.04 | 0.4428 | -0.0456 | 0.4168 | 0 | 73.58 | |
| r18 | log-skewed right sd=1 skew=+1 | 77.96 | 0.4638 | 66.42 | 0.4635 | -0.0261 | 0.4004 | 0.3528 | 84.88 | 216.5 |
| r19 | log-skewed right sd=1 skew=+0.5 | 87.79 | 0.4809 | 69.05 | 0.4808 | -0.0133 | 0.3957 | 0.4319 | 92.03 | 182.7 |
| r20 | lognormal sigma=1 | 100 | 0.5 | 69.94 | 0.5 | 0.0000 | 0.394 | 0.5 | 100 | 164.9 |
| r21 | bimodal equal modes | 43.49 | 0.3742 | 83.84 | 0.5 | 0.0000 | 0.3674 | 0.25 | 100 | 159.2 |
| r22 | bimodal left mode higher | 39.84 | 0.4063 | 65.21 | 0.4042 | -0.0839 | 0.4026 | 0.325 | 44.22 | 122.8 |
| r23 | bimodal right mode higher | 251 | 0.5937 | 65.21 | 0.5958 | 0.0839 | 0.4026 | 0.675 | 226.1 | 195.6 |
| r24 | normal straddling zero mean=0 | -0.753 | 0.2257 | 133.4 | 0.0000 | 0 | ||||
| r25 | normal straddling zero mean=0.5 | 0.9838 | 0.6858 | 104.5 | 0.5 | 0.5 | ||||
| r26 | normal straddling zero mean=1 | 1.287 | 0.6128 | 78.51 | 1 | 1 | ||||
| r27 | lognormal sigma=0.5 with zeros p0=0.25 | 100 | 0.625 | 78.78 | 0.5 | 0.0000 | 0.4469 | 0.625 | 80.62 | 84.99 |
| r28 | lognormal sigma=0.5 with zeros p0=0.42 | 100 | 0.71 | 106.3 | 0.5 | 0.0000 | 0.4469 | 0.71 | 57.99 | 65.72 |
| r29 | lognormal sigma=0.5 with zeros p0=0.47 | 0 | 0.47 | 106 | 0.5 | 0.0000 | 0.4469 | 0.735 | 45.3 | 60.06 |
| r30 | lognormal sigma=0.5 with zeros p0=0.6 | 0 | 0.6 | 80 | 0.5 | 0.0000 | 0.4469 | 0.8 | 0 | 45.33 |
| r31 | lognormal sigma=1 with zeros p0=0.25 | 100 | 0.625 | 102.5 | 0.5 | 0.0000 | 0.394 | 0.625 | 65 | 123.7 |
| r32 | lognormal sigma=1 with zeros p0=0.37 | 100 | 0.685 | 118.1 | 0.5 | 0.0000 | 0.394 | 0.685 | 44.08 | 103.9 |
| r33 | lognormal sigma=1 with zeros p0=0.42 | 0 | 0.42 | 116 | 0.5 | 0.0000 | 0.394 | 0.71 | 33.63 | 95.63 |
| r34 | lognormal sigma=1 with zeros p0=0.6 | 0 | 0.6 | 80 | 0.5 | 0.0000 | 0.394 | 0.8 | 0 | 65.95 |
| Row | setting | quantile level of the preferred candidate (measure: RMSE) | quantile level of the preferred candidate (measure: MAE) | quantile level of the preferred candidate (measure: MAPE) | quantile level of the preferred candidate (measure: sMAPE) | candidates whose expected score is infinite (measure: RMSE) | candidates whose expected score is infinite (measure: MAPE) |
|---|---|---|---|---|---|---|---|
| r1 | inverse Gaussian shape=1000 | 0.5616 | 0.4999 | 0.3786 | 0.4999 | 0 | 0 |
| r2 | inverse Gaussian shape=200 | 0.6277 | 0.5 | 0.2659 | 0.4978 | 0 | 0 |
| r3 | inverse Gaussian shape=100 | 0.6681 | 0.5 | 0.2158 | 0.4929 | 0 | 0 |
| r4 | inverse Gaussian shape=50 | 0.7138 | 0.5 | 0.1773 | 0.482 | 0 | 0 |
| r5 | inverse Gaussian shape=20 | 0.7768 | 0.5 | 0.1474 | 0.4578 | 0 | 0 |
| r6 | inverse Gaussian shape=10 | 0.8219 | 0.5 | 0.136 | 0.4387 | 0 | 0 |
| r7 | log-skewed left sd=0.5 skew=-2 | 0.4444 | 0.5 | 0.25 | 0.5211 | 0 | 0 |
| r8 | log-skewed left sd=0.5 skew=-1 | 0.5215 | 0.5 | 0.2799 | 0.513 | 0 | 0 |
| r9 | log-skewed left sd=0.5 skew=-0.5 | 0.5603 | 0.5 | 0.2941 | 0.5068 | 0 | 0 |
| r10 | log-skewed right sd=0.5 skew=+2 | 0.75 | 0.5 | 0.37 | 0.4789 | 102 | 0 |
| r11 | log-skewed right sd=0.5 skew=+1 | 0.6748 | 0.5 | 0.3388 | 0.487 | 0 | 0 |
| r12 | log-skewed right sd=0.5 skew=+0.5 | 0.6368 | 0.5 | 0.3234 | 0.4932 | 0 | 0 |
| r13 | lognormal sigma=0.5 | 0.5987 | 0.5 | 0.3085 | 0.5 | 0 | 0 |
| r14 | log-skewed left sd=1 skew=-2 | 0.5 | 0.5 | 0 | 0.5562 | 0 | 101 |
| r15 | log-skewed left sd=1 skew=-1 | 0.5928 | 0.5 | 0.0655 | 0.5362 | 0 | 0 |
| r16 | log-skewed left sd=1 skew=-0.5 | 0.6413 | 0.5 | 0.1155 | 0.5191 | 0 | 0 |
| r17 | log-skewed right sd=1 skew=+2 | 0.5 | 0.2929 | 0.4438 | 103 | 0 | |
| r18 | log-skewed right sd=1 skew=+1 | 0.8034 | 0.5 | 0.2314 | 0.4638 | 104 | 0 |
| r19 | log-skewed right sd=1 skew=+0.5 | 0.7446 | 0.5 | 0.1968 | 0.4809 | 0 | 0 |
| r20 | lognormal sigma=1 | 0.6915 | 0.5 | 0.1587 | 0.5 | 0 | 0 |
| r21 | bimodal equal modes | 0.5081 | 0.5 | 0.2341 | 0.3742 | 0 | 0 |
| r22 | bimodal left mode higher | 0.6503 | 0.5 | 0.2841 | 0.4063 | 0 | 0 |
| r23 | bimodal right mode higher | 0.4111 | 0.5 | 0.1848 | 0.5937 | 0 | 0 |
| r24 | normal straddling zero mean=0 | 0.5 | 0.5 | 0.5 | 0.7743 | 0 | 100 |
| r25 | normal straddling zero mean=0.5 | 0.5 | 0.5 | 0.3085 | 0.6858 | 0 | 101 |
| r26 | normal straddling zero mean=1 | 0.5 | 0.5 | 0.1587 | 0.6128 | 0 | 101 |
| r27 | lognormal sigma=0.5 with zeros p0=0.25 | 0.5293 | 0.5 | 0.625 | 0 | 77 | |
| r28 | lognormal sigma=0.5 with zeros p0=0.42 | 0.5364 | 0.5 | 0.71 | 0 | 59 | |
| r29 | lognormal sigma=0.5 with zeros p0=0.47 | 0.5516 | 0.5 | 0.47 | 0 | 55 | |
| r30 | lognormal sigma=0.5 with zeros p0=0.6 | 0.6227 | 0.6 | 0.6 | 0 | 41 | |
| r31 | lognormal sigma=1 with zeros p0=0.25 | 0.6881 | 0.5 | 0.625 | 0 | 77 | |
| r32 | lognormal sigma=1 with zeros p0=0.37 | 0.6945 | 0.5 | 0.685 | 0 | 65 | |
| r33 | lognormal sigma=1 with zeros p0=0.42 | 0.6997 | 0.5 | 0.42 | 0 | 59 | |
| r34 | lognormal sigma=1 with zeros p0=0.6 | 0.7354 | 0.6 | 0.6 | 0 | 41 |
Everything recorded for this evidence: E13 in the record.
Earlier work and other claims
- Supports claim C4. Computed on 34 distributions, the target lies on the side of the median that carries more weight, as claim C4 and claim C12 prove.
- Supports claim C5. Computed on lognormal outcomes, the target is the median, as claim C5 proves.
- Supports claim C6. Computed on bimodal outcomes, the target is two forecasts, one near each mode, when the modes are equal, and the larger mode's when they are not, as claim C6 proves.
- Supports claim C7. Computed on lognormal outcomes with zeros, the target switches to 0 at a share of zeros below one half, as claim C7 proves.
- Supports claim C11. Computed on normal outcomes straddling zero, the target lies away from zero, on the side of the mean, as claim C11 proves.
estimated as plannedRecord
- Claim
- C13 · descriptive · secondary · no earlier result found
- Plan
- Estimate planned in lab plan PL1, recorded 16 November 2026
- Evidence
- E13 in the record
- Scope
- data: outcome distributions given exactly (no data); conditions: 34 distributions: inverse Gaussian, log-skewed, lognormal, bimodal, normal straddling zero, zero-inflated lognormal
- Limitations
- L1
- Support score
- SupportS 93 of 100. The score checks the record, not the science.
- Record
- This claim on the record page
Term this claim uses
- ranking agreement
- For one distribution, one measure, a test-set size , the measure's target and a forecast at another quantile level: the probability that a test set of outcomes gives the target the strictly lower score (ties count as disagreement); 0.5 is a coin toss.
Numerical check C14. Flattening, computed
As the data spread out, the best possible sMAPE rises towards its worst value, the forecast it rewards moves from the median towards the most likely value on the log scale, and sMAPE ranks its own best forecast first less often than MAE does.
As the spread of grows from 0.1 to 10, the expected sMAPE at the sMAPE target rises towards its bound 200 (from 7.97 to 178.2 on lognormal outcomes), the target's quantile level moves from the median to that of the mode of (0.372 against the mode's 0.368 at on log-Gumbel outcomes skewed right), and the ranking agreement of sMAPE, for its target against a forecast half a away, is lower than that of MAE: at with test sets of 12 outcomes it ranks its target first in 0.61 of the test sets, MAE in 0.82.
Evidence
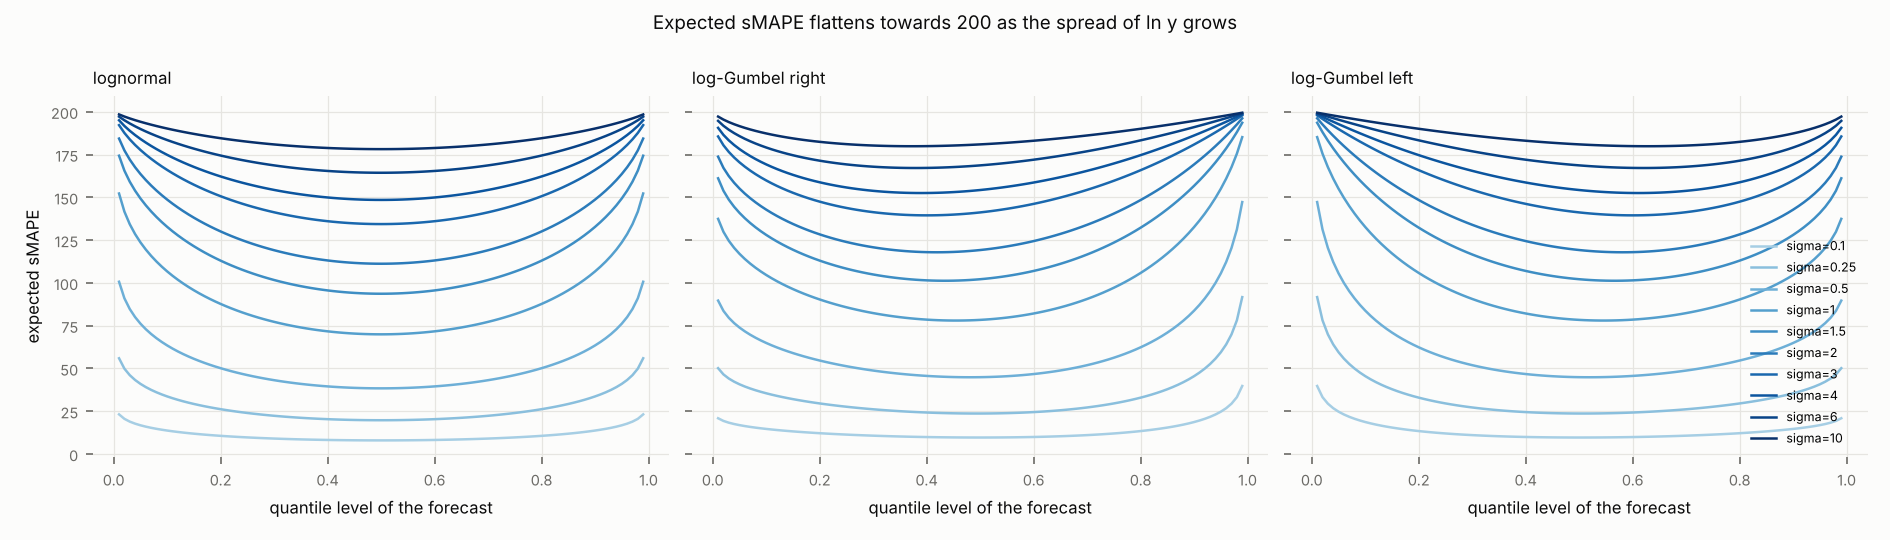
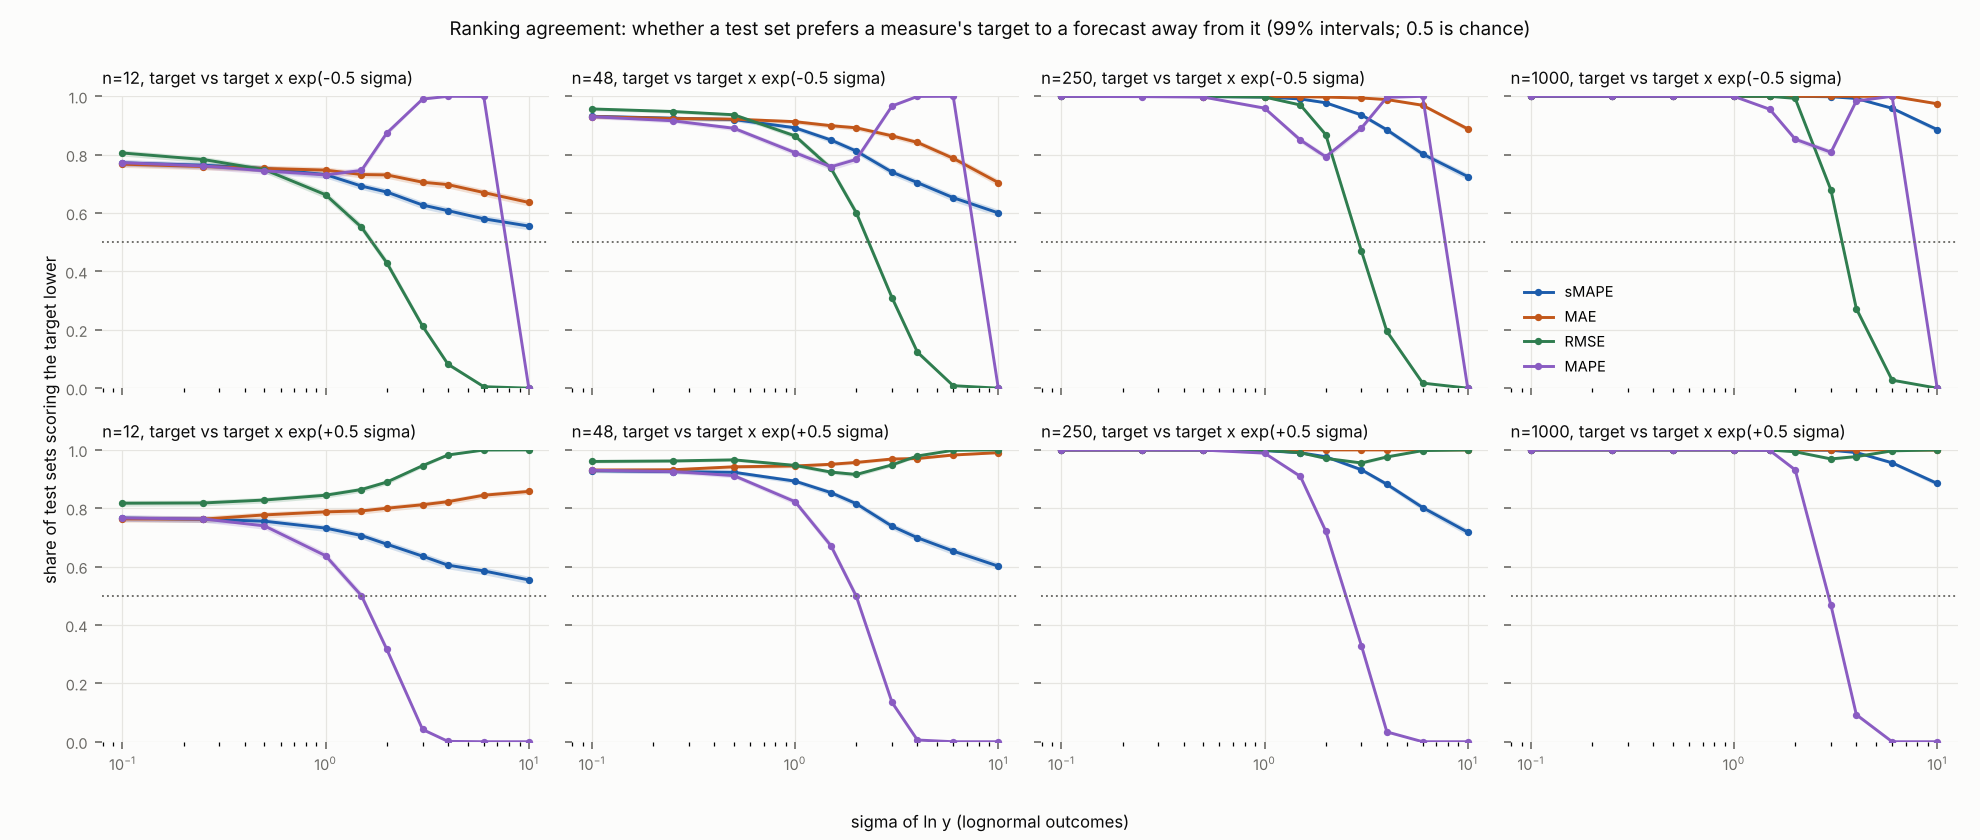
| Row | setting | quantile level of the sMAPE target | quantile level of the log-mode | expected sMAPE at the target | large-spread approximation of expected sMAPE at the target | local minima of expected sMAPE |
|---|---|---|---|---|---|---|
| r1 | lognormal sigma=0.1 | 0.5 | 0.5 | 7.966 | -2012 | 1 |
| r2 | log-Gumbel right sigma=0.1 | 0.4989 | 0.3679 | 9.643 | -1724 | 1 |
| r3 | log-Gumbel left sigma=0.1 | 0.5011 | 0.6321 | 9.643 | -1724 | 1 |
| r4 | lognormal sigma=0.25 | 0.5 | 0.5 | 19.74 | -684.9 | 1 |
| r5 | log-Gumbel right sigma=0.25 | 0.494 | 0.3679 | 23.66 | -572.7 | 1 |
| r6 | log-Gumbel left sigma=0.25 | 0.506 | 0.6321 | 23.66 | -572.7 | 1 |
| r7 | lognormal sigma=0.5 | 0.5 | 0.5 | 38.38 | -242.4 | 1 |
| r8 | log-Gumbel right sigma=0.5 | 0.4811 | 0.3679 | 44.85 | -190.4 | 1 |
| r9 | log-Gumbel left sigma=0.5 | 0.5189 | 0.6321 | 44.85 | -190.4 | 1 |
| r10 | lognormal sigma=1 | 0.5 | 0.5 | 69.94 | -21.22 | 1 |
| r11 | log-Gumbel right sigma=1 | 0.4544 | 0.3679 | 77.99 | 1.246 | 1 |
| r12 | log-Gumbel left sigma=1 | 0.5456 | 0.6321 | 77.99 | 1.246 | 1 |
| r13 | lognormal sigma=1.5 | 0.5 | 0.5 | 93.66 | 52.52 | 1 |
| r14 | log-Gumbel right sigma=1.5 | 0.4337 | 0.3679 | 101.2 | 66.06 | 1 |
| r15 | log-Gumbel left sigma=1.5 | 0.5663 | 0.6321 | 101.2 | 66.06 | 1 |
| r16 | lognormal sigma=2 | 0.5 | 0.5 | 111.2 | 89.39 | 1 |
| r17 | log-Gumbel right sigma=2 | 0.4187 | 0.3679 | 117.9 | 98.93 | 1 |
| r18 | log-Gumbel left sigma=2 | 0.5813 | 0.6321 | 117.9 | 98.93 | 1 |
| r19 | lognormal sigma=3 | 0.5 | 0.5 | 134.4 | 126.3 | 1 |
| r20 | log-Gumbel right sigma=3 | 0.3999 | 0.3679 | 139.5 | 132.3 | 1 |
| r21 | log-Gumbel left sigma=3 | 0.6001 | 0.6321 | 139.5 | 132.3 | 1 |
| r22 | lognormal sigma=4 | 0.5 | 0.5 | 148.5 | 144.7 | 1 |
| r23 | log-Gumbel right sigma=4 | 0.3894 | 0.3679 | 152.5 | 149.1 | 1 |
| r24 | log-Gumbel left sigma=4 | 0.6106 | 0.6321 | 152.5 | 149.1 | 1 |
| r25 | lognormal sigma=6 | 0.5 | 0.5 | 164.4 | 163.1 | 1 |
| r26 | log-Gumbel right sigma=6 | 0.3792 | 0.3679 | 167.1 | 166 | 1 |
| r27 | log-Gumbel left sigma=6 | 0.6208 | 0.6321 | 167.1 | 166 | 1 |
| r28 | lognormal sigma=10 | 0.5 | 0.5 | 178.2 | 177.9 | 1 |
| r29 | log-Gumbel right sigma=10 | 0.3724 | 0.3679 | 179.9 | 179.6 | 1 |
| r30 | log-Gumbel left sigma=10 | 0.6276 | 0.6321 | 179.9 | 179.6 | 1 |
| Row | setting | test-set size | ranking agreement (measure: RMSE, offset in sigma: 0.5) | ranking agreement (measure: MAE, offset in sigma: 0.5) | ranking agreement (measure: MAPE, offset in sigma: 0.5) | ranking agreement (measure: sMAPE, offset in sigma: 0.5) |
|---|---|---|---|---|---|---|
| r1 | lognormal sigma=0.5 | 12 | 0.8282 | 0.7772 | 0.7396 | 0.7557 |
| r2 | lognormal sigma=0.5 | 48 | 0.9659 | 0.9421 | 0.9118 | 0.9233 |
| r3 | lognormal sigma=0.5 | 250 | 0.9998 | 0.9999 | 0.9994 | 0.9994 |
| r4 | lognormal sigma=0.5 | 1000 | 1 | 1 | 1 | 1 |
| r5 | lognormal sigma=4 | 12 | 0.9826 | 0.8226 | 0.0012 | 0.605 |
| r6 | lognormal sigma=4 | 48 | 0.9792 | 0.9705 | 0.0059 | 0.6989 |
| r7 | lognormal sigma=4 | 250 | 0.9759 | 1 | 0.0337 | 0.8823 |
| r8 | lognormal sigma=4 | 1000 | 0.9771 | 1 | 0.0928 | 0.9909 |
Everything recorded for this evidence: E14 in the record.
Earlier work and other claims
estimated as plannedRecord
- Claim
- C14 · descriptive · secondary · no earlier result found
- Plan
- Estimate planned in lab plan PL4, recorded 16 November 2026
- Evidence
- E14 in the record
- Scope
- data: outcome distributions given exactly, and test sets drawn from them; conditions: lognormal and log-Gumbel outcomes, spread of ln y from 0.1 to 10, test sets of 12 to 1000 outcomes
- Support score
- SupportS 93 of 100. The score checks the record, not the science.
- Record
- This claim on the record page
14 more definitions that no claim names (designs, data, cases) are on the record page.
Limitations
Lab run RN1 deviated from plan PL1: RN1 ran at commit 3cb6c7c, not the plan's 92cd9a5. Between them only flatness.py and plot_flatness.py (plan PL3), test_smape.py and measures.py changed; in measures.py the unused function log_mae was removed (the supervisor dropped log-MAE from PL3, DC3). targets.py, theory.py, dists.py and the measures targets.py uses are unchanged. Reason: The commit of the PL3 revision came between PL1's plan and its run; it does not touch what PL1 runs.
Lab run RN7 deviated from plan PL2: RN7 ran efficiency.py at commit fa0ce62, not the plan's 92cd9a5: the script runs its 16 settings in parallel processes (one per core) instead of one after another; theory.py also gained a function (balance_exact) that efficiency.py does not use. Each (setting, test-set size) draws from its own seed as before, and on a subset the parallel code and the plan's code gave byte-identical results.json. Reason: Three earlier attempts on one core (over an hour) were killed by container restarts before the lab recorded them (notes NT2.R2, NT5, NT6); in parallel the run finished in about 20 minutes. The analysis, the settings, the seeds and the results are unchanged.
The test sets are independent draws from a fixed distribution. Real forecast errors are often correlated and their distribution can change over a test period, so a real test set carries less information than the same number of outcomes here.
Only the distribution families studied were computed; the formal claims (C4, C10) say what holds beyond them, the simulations only illustrate it.
C6 is proved for two groups that mirror each other about the median on the log scale. It is not proved for groups of different shape or spread.
The definition of msMAPE is taken from Kolassa (2026, Definition 4). Smyl's article was not read. Smyl gives no value for the constant; ν = 0.1, 0.5 and 1 are this paper's choices.
That the relative efficiency of finite test sets tends to the asymptotic value is not shown; the simulation of C15 agrees with it at n = 10000.
References
- Anderson, T. W., 1955. The integral of a symmetric unimodal function over a symmetric convex set and some probability inequalities. Proceedings of the American Mathematical Society 6, 170–176. https://doi.org/10.1090/S0002-9939-1955-0069229-1 Used by: Context
- Chen, C., Twycross, J., Garibaldi, J. M., 2017. A new accuracy measure based on bounded relative error for time series forecasting. PLOS ONE 12, e0174202. https://doi.org/10.1371/journal.pone.0174202 Used by: Context
- Goodwin, P., Lawton, R., 1999. On the asymmetry of the symmetric MAPE. International Journal of Forecasting 15, 405–408. https://doi.org/10.1016/S0169-2070(99)00007-2 Used by: Context
- Hewamalage, H., Bergmeir, C., Bandara, K., 2021. Recurrent Neural Networks for Time Series Forecasting: Current status and future directions. International Journal of Forecasting 37, 388–427. https://doi.org/10.1016/j.ijforecast.2020.06.008 Used by: Context, D28
- Hewamalage, H., Ackermann, K., Bergmeir, C., 2023. Forecast evaluation for data scientists: common pitfalls and best practices. Data Mining and Knowledge Discovery 37, 788–832. https://doi.org/10.1007/s10618-022-00894-5 Used by: Context
- Hyndman, R. J., Koehler, A. B., 2006. Another look at measures of forecast accuracy. International Journal of Forecasting 22, 679–688. https://doi.org/10.1016/j.ijforecast.2006.03.001 Used by: Context
- Kolassa, S., 2026. The Symmetric Mean Absolute Percentage Error: Unnecessary or Dangerous. Forecasting 8, 24. https://doi.org/10.3390/forecast8020024 Used by: Context, D33
- Makridakis, S., 1993. Accuracy measures: theoretical and practical concerns. International Journal of Forecasting 9, 527–529. https://doi.org/10.1016/0169-2070(93)90079-3 Used by: D2
- Smyl, S. (2025). Sparse-Proof sMAPE. Foresight: The International Journal of Applied Forecasting, 78, 29–30. https://ideas.repec.org/a/for/ijafaa/y2025i78p29-30.html Used by: Context
- Svetunkov, I., 2026a. Evaluating forecasts and classifiers: which measures, scoring rules and tests to use. EntryLib. entrylib:2026.000008@v2 Claims cited: C6, C33. Used by: Context
- Svetunkov, I., 2026b. Which forecast does each error measure reward? A simulation study of the functionals targeted by RMSE, MAE, MAPE and sMAPE. EntryLib. entrylib:2026.000009@v1 Claims cited: C5, C6, C11. Used by: Context
- Tofallis, C., 2015. A better measure of relative prediction accuracy for model selection and model estimation. Journal of the Operational Research Society 66, 1352–1362. https://doi.org/10.1057/jors.2014.103 Used by: Context
- Vaart, A. W. v. d., 1998. Asymptotic Statistics. Cambridge University Press. https://doi.org/10.1017/CBO9780511802256 Used by: C19
Score
Support of the paper: 99, Well supported
Scores are computed by rules from the claimset file (EntryLib rubric 0.7): they check the record, not the science, and may change as the rubric and reviews develop. The rubric. Every issue as text, for an agent preparing the next version.
The mean of its 13 principal claims; the lowest is C15 at 89. Open problems in the principal claims and what they rest on, each counted once, with the most it costs a claim:
- −6 Open problems Limitation L2 (could bias magnitude, not mitigated): Lab run RN7 deviated from plan PL2: RN7 ran efficiency.py at commit fa0ce62, not the plan's 92cd9a5: the script runs its 16 settings in parallel processes (one per core) instead of one after another; theory.py also gained a function (balance_exact) that efficiency.py does not use. Each (setting, test-set size) draws from its own seed as before, and on a subset the parallel code and the plan's code gave byte-identical results.json. Reason: Three earlier attempts on one core (over an hour) were killed by container restarts before the lab recorded them (notes NT2.R2, NT5, NT6); in parallel the run finished in about 20 minutes. The analysis, the settings, the seeds and the results are unchanged. In C15. To remove it: Mitigate it with evidence, or narrow the claim's scope so that it no longer applies.
- −5 Context A principal claim related to no earlier work. In C6. To remove it: Relate the claim to the earlier work it extends, addresses or departs from.
- −3 Plan The lab record flags the test: code changed after plan. In C15. To remove it: Rerun the test as planned, or explain the flag in a limitation.
- −1 Open problems Limitation L3 (reduces transferability, not mitigated): The test sets are independent draws from a fixed distribution. Real forecast errors are often correlated and their distribution can change over a test period, so a real test set carries less information than the same number of outcomes here. In C14, C15, C21. To remove it: Mitigate it with evidence, or narrow the claim's scope so that it no longer applies.
- −1 Open problems Limitation L4 (reduces transferability, not mitigated): Only the distribution families studied were computed; the formal claims (C4, C10) say what holds beyond them, the simulations only illustrate it. In C13, C14, C15, C16, C21. To remove it: Mitigate it with evidence, or narrow the claim's scope so that it no longer applies.
- −1 Open problems Limitation L5 (reduces transferability, not mitigated): C6 is proved for two groups that mirror each other about the median on the log scale. It is not proved for groups of different shape or spread. In C6. To remove it: Mitigate it with evidence, or narrow the claim's scope so that it no longer applies.
- −1 Open problems Limitation L6 (reduces transferability, not mitigated): The definition of msMAPE is taken from Kolassa (2026, Definition 4). Smyl's article was not read. Smyl gives no value for the constant; ν = 0.1, 0.5 and 1 are this paper's choices. In C20, C21. To remove it: Mitigate it with evidence, or narrow the claim's scope so that it no longer applies.
Claims
C6: 94, Well supported
Novelty: new, by the authors
- −5 Context A principal claim related to no earlier work. To remove it: Relate the claim to the earlier work it extends, addresses or departs from.
- −1 Open problems Limitation L5 (reduces transferability, not mitigated): C6 is proved for two groups that mirror each other about the median on the log scale. It is not proved for groups of different shape or spread. To remove it: Mitigate it with evidence, or narrow the claim's scope so that it no longer applies.
C13: 93, Well supported
Novelty: new, by the authors
- −6 Open problems Limitation L1 (could bias magnitude, not mitigated): Lab run RN1 deviated from plan PL1: RN1 ran at commit 3cb6c7c, not the plan's 92cd9a5. Between them only flatness.py and plot_flatness.py (plan PL3), test_smape.py and measures.py changed; in measures.py the unused function log_mae was removed (the supervisor dropped log-MAE from PL3, DC3). targets.py, theory.py, dists.py and the measures targets.py uses are unchanged. Reason: The commit of the PL3 revision came between PL1's plan and its run; it does not touch what PL1 runs. To remove it: Mitigate it with evidence, or narrow the claim's scope so that it no longer applies.
- −1 Open problems Limitation L4 (reduces transferability, not mitigated): Only the distribution families studied were computed; the formal claims (C4, C10) say what holds beyond them, the simulations only illustrate it. To remove it: Mitigate it with evidence, or narrow the claim's scope so that it no longer applies.
C14: 93, Well supported
Novelty: new, by the authors
- −5 Context Numbers in the statement match no recorded result. To remove it: Record each number as a result or table cell of the evidence the claim cites, and list it in the support's results; or correct the number.
- −1 Open problems Limitation L3 (reduces transferability, not mitigated): The test sets are independent draws from a fixed distribution. Real forecast errors are often correlated and their distribution can change over a test period, so a real test set carries less information than the same number of outcomes here. To remove it: Mitigate it with evidence, or narrow the claim's scope so that it no longer applies.
- −1 Open problems Limitation L4 (reduces transferability, not mitigated): Only the distribution families studied were computed; the formal claims (C4, C10) say what holds beyond them, the simulations only illustrate it. To remove it: Mitigate it with evidence, or narrow the claim's scope so that it no longer applies.
C15: 89, Well supported
Novelty: new, by the authors
- −6 Open problems Limitation L2 (could bias magnitude, not mitigated): Lab run RN7 deviated from plan PL2: RN7 ran efficiency.py at commit fa0ce62, not the plan's 92cd9a5: the script runs its 16 settings in parallel processes (one per core) instead of one after another; theory.py also gained a function (balance_exact) that efficiency.py does not use. Each (setting, test-set size) draws from its own seed as before, and on a subset the parallel code and the plan's code gave byte-identical results.json. Reason: Three earlier attempts on one core (over an hour) were killed by container restarts before the lab recorded them (notes NT2.R2, NT5, NT6); in parallel the run finished in about 20 minutes. The analysis, the settings, the seeds and the results are unchanged. To remove it: Mitigate it with evidence, or narrow the claim's scope so that it no longer applies.
- −3 Plan The lab record flags the test: code changed after plan. To remove it: Rerun the test as planned, or explain the flag in a limitation.
- −1 Open problems Limitation L3 (reduces transferability, not mitigated): The test sets are independent draws from a fixed distribution. Real forecast errors are often correlated and their distribution can change over a test period, so a real test set carries less information than the same number of outcomes here. To remove it: Mitigate it with evidence, or narrow the claim's scope so that it no longer applies.
- −1 Open problems Limitation L4 (reduces transferability, not mitigated): Only the distribution families studied were computed; the formal claims (C4, C10) say what holds beyond them, the simulations only illustrate it. To remove it: Mitigate it with evidence, or narrow the claim's scope so that it no longer applies.
C16: 99, Well supported
Novelty: new, by the authors
- −1 Open problems Limitation L4 (reduces transferability, not mitigated): Only the distribution families studied were computed; the formal claims (C4, C10) say what holds beyond them, the simulations only illustrate it. To remove it: Mitigate it with evidence, or narrow the claim's scope so that it no longer applies.
C20: 99, Well supported
Novelty: extends earlier work, by the authors
- −1 Open problems Limitation L6 (reduces transferability, not mitigated): The definition of msMAPE is taken from Kolassa (2026, Definition 4). Smyl's article was not read. Smyl gives no value for the constant; ν = 0.1, 0.5 and 1 are this paper's choices. To remove it: Mitigate it with evidence, or narrow the claim's scope so that it no longer applies.
C21: 97, Well supported
Novelty: new, by the authors
- −1 Open problems Limitation L3 (reduces transferability, not mitigated): The test sets are independent draws from a fixed distribution. Real forecast errors are often correlated and their distribution can change over a test period, so a real test set carries less information than the same number of outcomes here. To remove it: Mitigate it with evidence, or narrow the claim's scope so that it no longer applies.
- −1 Open problems Limitation L4 (reduces transferability, not mitigated): Only the distribution families studied were computed; the formal claims (C4, C10) say what holds beyond them, the simulations only illustrate it. To remove it: Mitigate it with evidence, or narrow the claim's scope so that it no longer applies.
- −1 Open problems Limitation L6 (reduces transferability, not mitigated): The definition of msMAPE is taken from Kolassa (2026, Definition 4). Smyl's article was not read. Smyl gives no value for the constant; ν = 0.1, 0.5 and 1 are this paper's choices. To remove it: Mitigate it with evidence, or narrow the claim's scope so that it no longer applies.
Not claimed
Planned proofs that give no claim of their own; the lab record has each with its reason.
- Reworded, then proved again: H1 → C1, H2 → C2, H3 → C3, H23 → C3, H4 → C4, H33 → C4, H5 → C5, H18 → C6, H8 → C7, H12 → C8, H13 → C9, H19 → C10, H34 → C12, H35 → C17, H39 (not supported) → C18, H39 (not supported) → C18, H43 (inconclusive) → C18, H45 (inconclusive) → C18, H40 (not supported) → C19
- Merged: H16 (inconclusive) → C4, H9 (inconclusive) → C3, H10 (inconclusive) → C2
- Dropped: H11 (inconclusive)
Versions
- Version 3 (this page) · 18 November 2026 at 13:08 UTC · updated
- Version 2 · 17 November 2026 at 22:21 UTC · updated
- Version 1 · 17 November 2026 at 15:01 UTC · active
Every version is kept in the public registry (github.com/entrylib/registry).
- A14 inverse Gaussian shape=10: for each measure (RMSE, MAE, MAPE, sMAPE), one violin per test-set size showing how the candidate the measure ranks first is spread over 1000 test sets, as its quantile level, with a boxplot of its median, quartiles and 5th and 95th percentiles and a diamond at its mean; a dashed line marks the measure's preferred candidate and dotted lines the other measures'. Drawn by lab run RN1 from its own results (lab/runs/RN1/figures/inverse_Gaussian_shape=10.png).
- A23 log-skewed left sd=1 skew=-1: for each measure (RMSE, MAE, MAPE, sMAPE), one violin per test-set size showing how the candidate the measure ranks first is spread over 1000 test sets, as its quantile level, with a boxplot of its median, quartiles and 5th and 95th percentiles and a diamond at its mean; a dashed line marks the measure's preferred candidate and dotted lines the other measures'. Drawn by lab run RN1 from its own results (lab/runs/RN1/figures/log-skewed_left_sd=1_skew=-1.png).
- A26 log-skewed right sd=1 skew=+1: for each measure (RMSE, MAE, MAPE, sMAPE), one violin per test-set size showing how the candidate the measure ranks first is spread over 1000 test sets, as its quantile level, with a boxplot of its median, quartiles and 5th and 95th percentiles and a diamond at its mean; a dashed line marks the measure's preferred candidate and dotted lines the other measures'. Drawn by lab run RN1 from its own results (lab/runs/RN1/figures/log-skewed_right_sd=1_skew=_1.png).
- A21 lognormal sigma=0.5: for each measure (RMSE, MAE, MAPE, sMAPE), one violin per test-set size showing how the candidate the measure ranks first is spread over 1000 test sets, as its quantile level, with a boxplot of its median, quartiles and 5th and 95th percentiles and a diamond at its mean; a dashed line marks the measure's preferred candidate and dotted lines the other measures'. Drawn by lab run RN1 from its own results (lab/runs/RN1/figures/lognormal_sigma=0.5.png).
- A28 lognormal sigma=1: for each measure (RMSE, MAE, MAPE, sMAPE), one violin per test-set size showing how the candidate the measure ranks first is spread over 1000 test sets, as its quantile level, with a boxplot of its median, quartiles and 5th and 95th percentiles and a diamond at its mean; a dashed line marks the measure's preferred candidate and dotted lines the other measures'. Drawn by lab run RN1 from its own results (lab/runs/RN1/figures/lognormal_sigma=1.png).
- A50 lognormal outcomes: relative efficiency of the sMAPE minimiser of a test set against the sample median, against test-set size, one panel per spread, with its 99% band and the large-sample value as a dashed line; below 1 the sMAPE minimiser varies more than the sample median. Drawn by lab run RN7 from its own results (lab/runs/RN7/figures/efficiency_lognormal.png).
- A51 log-Laplace outcomes: relative efficiency of the sMAPE minimiser of a test set against the sample median, against test-set size, one panel per spread, with its 99% band and the large-sample value as a dashed line; below 1 the sMAPE minimiser varies more than the sample median. Drawn by lab run RN7 from its own results (lab/runs/RN7/figures/efficiency_log-Laplace.png).
- A29 bimodal equal modes: for each measure (RMSE, MAE, MAPE, sMAPE), one violin per test-set size showing how the candidate the measure ranks first is spread over 1000 test sets, as its quantile level, with a boxplot of its median, quartiles and 5th and 95th percentiles and a diamond at its mean; a dashed line marks the measure's preferred candidate and dotted lines the other measures'. Drawn by lab run RN1 from its own results (lab/runs/RN1/figures/bimodal_equal_modes.png).
- A30 bimodal left mode higher: for each measure (RMSE, MAE, MAPE, sMAPE), one violin per test-set size showing how the candidate the measure ranks first is spread over 1000 test sets, as its quantile level, with a boxplot of its median, quartiles and 5th and 95th percentiles and a diamond at its mean; a dashed line marks the measure's preferred candidate and dotted lines the other measures'. Drawn by lab run RN1 from its own results (lab/runs/RN1/figures/bimodal_left_mode_higher.png).
- A31 bimodal right mode higher: for each measure (RMSE, MAE, MAPE, sMAPE), one violin per test-set size showing how the candidate the measure ranks first is spread over 1000 test sets, as its quantile level, with a boxplot of its median, quartiles and 5th and 95th percentiles and a diamond at its mean; a dashed line marks the measure's preferred candidate and dotted lines the other measures'. Drawn by lab run RN1 from its own results (lab/runs/RN1/figures/bimodal_right_mode_higher.png).
- A35 lognormal sigma=0.5 with zeros p0=0.25: for each measure (RMSE, MAE, MAPE, sMAPE), one violin per test-set size showing how the candidate the measure ranks first is spread over 1000 test sets, as its quantile level, with a boxplot of its median, quartiles and 5th and 95th percentiles and a diamond at its mean; a dashed line marks the measure's preferred candidate and dotted lines the other measures'. Drawn by lab run RN1 from its own results (lab/runs/RN1/figures/lognormal_sigma=0.5_with_zeros_p0=0.25.png).
- A36 lognormal sigma=0.5 with zeros p0=0.42: for each measure (RMSE, MAE, MAPE, sMAPE), one violin per test-set size showing how the candidate the measure ranks first is spread over 1000 test sets, as its quantile level, with a boxplot of its median, quartiles and 5th and 95th percentiles and a diamond at its mean; a dashed line marks the measure's preferred candidate and dotted lines the other measures'. Drawn by lab run RN1 from its own results (lab/runs/RN1/figures/lognormal_sigma=0.5_with_zeros_p0=0.42.png).
- A37 lognormal sigma=0.5 with zeros p0=0.47: for each measure (RMSE, MAE, MAPE, sMAPE), one violin per test-set size showing how the candidate the measure ranks first is spread over 1000 test sets, as its quantile level, with a boxplot of its median, quartiles and 5th and 95th percentiles and a diamond at its mean; a dashed line marks the measure's preferred candidate and dotted lines the other measures'. Drawn by lab run RN1 from its own results (lab/runs/RN1/figures/lognormal_sigma=0.5_with_zeros_p0=0.47.png).
- A38 lognormal sigma=0.5 with zeros p0=0.6: for each measure (RMSE, MAE, MAPE, sMAPE), one violin per test-set size showing how the candidate the measure ranks first is spread over 1000 test sets, as its quantile level, with a boxplot of its median, quartiles and 5th and 95th percentiles and a diamond at its mean; a dashed line marks the measure's preferred candidate and dotted lines the other measures'. Drawn by lab run RN1 from its own results (lab/runs/RN1/figures/lognormal_sigma=0.5_with_zeros_p0=0.6.png).
- A39 lognormal sigma=1 with zeros p0=0.25: for each measure (RMSE, MAE, MAPE, sMAPE), one violin per test-set size showing how the candidate the measure ranks first is spread over 1000 test sets, as its quantile level, with a boxplot of its median, quartiles and 5th and 95th percentiles and a diamond at its mean; a dashed line marks the measure's preferred candidate and dotted lines the other measures'. Drawn by lab run RN1 from its own results (lab/runs/RN1/figures/lognormal_sigma=1_with_zeros_p0=0.25.png).
- A40 lognormal sigma=1 with zeros p0=0.37: for each measure (RMSE, MAE, MAPE, sMAPE), one violin per test-set size showing how the candidate the measure ranks first is spread over 1000 test sets, as its quantile level, with a boxplot of its median, quartiles and 5th and 95th percentiles and a diamond at its mean; a dashed line marks the measure's preferred candidate and dotted lines the other measures'. Drawn by lab run RN1 from its own results (lab/runs/RN1/figures/lognormal_sigma=1_with_zeros_p0=0.37.png).
- A41 lognormal sigma=1 with zeros p0=0.42: for each measure (RMSE, MAE, MAPE, sMAPE), one violin per test-set size showing how the candidate the measure ranks first is spread over 1000 test sets, as its quantile level, with a boxplot of its median, quartiles and 5th and 95th percentiles and a diamond at its mean; a dashed line marks the measure's preferred candidate and dotted lines the other measures'. Drawn by lab run RN1 from its own results (lab/runs/RN1/figures/lognormal_sigma=1_with_zeros_p0=0.42.png).
- A42 lognormal sigma=1 with zeros p0=0.6: for each measure (RMSE, MAE, MAPE, sMAPE), one violin per test-set size showing how the candidate the measure ranks first is spread over 1000 test sets, as its quantile level, with a boxplot of its median, quartiles and 5th and 95th percentiles and a diamond at its mean; a dashed line marks the measure's preferred candidate and dotted lines the other measures'. Drawn by lab run RN1 from its own results (lab/runs/RN1/figures/lognormal_sigma=1_with_zeros_p0=0.6.png).
- A32 normal straddling zero mean=0: for each measure (RMSE, MAE, MAPE, sMAPE), one violin per test-set size showing how the candidate the measure ranks first is spread over 1000 test sets, as its quantile level, with a boxplot of its median, quartiles and 5th and 95th percentiles and a diamond at its mean; a dashed line marks the measure's preferred candidate and dotted lines the other measures'. Drawn by lab run RN1 from its own results (lab/runs/RN1/figures/normal_straddling_zero_mean=0.png).
- A33 normal straddling zero mean=0.5: for each measure (RMSE, MAE, MAPE, sMAPE), one violin per test-set size showing how the candidate the measure ranks first is spread over 1000 test sets, as its quantile level, with a boxplot of its median, quartiles and 5th and 95th percentiles and a diamond at its mean; a dashed line marks the measure's preferred candidate and dotted lines the other measures'. Drawn by lab run RN1 from its own results (lab/runs/RN1/figures/normal_straddling_zero_mean=0.5.png).
- A34 normal straddling zero mean=1: for each measure (RMSE, MAE, MAPE, sMAPE), one violin per test-set size showing how the candidate the measure ranks first is spread over 1000 test sets, as its quantile level, with a boxplot of its median, quartiles and 5th and 95th percentiles and a diamond at its mean; a dashed line marks the measure's preferred candidate and dotted lines the other measures'. Drawn by lab run RN1 from its own results (lab/runs/RN1/figures/normal_straddling_zero_mean=1.png).
- A44 The quantile level of the sMAPE target against the spread sigma of ln y, for lognormal and log-Gumbel outcomes, beside the level of the log-mode: the target moves from the median to the mode of ln y as the spread grows. Drawn by lab run RN2 from its own results (lab/runs/RN2/figures/flatness_target.png).
- A45 Expected sMAPE against the quantile level of the forecast, one curve per spread sigma, for each family: the curve flattens towards 200 as sigma grows. Drawn by lab run RN2 from its own results (lab/runs/RN2/figures/flatness_expected_sMAPE.png).
- A53 The Suilin loss beside sMAPE: near zero, the two targets as a share of the median against the share of zeros, for lognormal outcomes at medians 1 and 100, with the zero thresholds at median 1; away from zero, the relative difference of the Suilin target from the sMAPE target for each distribution; on Poisson counts, the two targets against the mean. The figure was drawn when the paper called the Suilin loss msMAPE, and labels it so. Drawn by lab run RN11 from the recorded results of RN10 (lab/runs/RN11/figures/msmape_targets.png).
- A56 The forecast with the lowest expected score (the target) against the share of zero actuals, on intermittent demand: one panel per family of settings (Poisson counts, negative binomial counts, lognormal demand sizes with zeros), one line per measure (sMAPE, msMAPE with nu = 0.1, 0.5 and 1, the Suilin loss). Drawn by lab run RN15 from its own results (lab/runs/RN15/figures/msmape_intermittent.png).
- A53 The Suilin loss beside sMAPE: near zero, the two targets as a share of the median against the share of zeros, for lognormal outcomes at medians 1 and 100, with the zero thresholds at median 1; away from zero, the relative difference of the Suilin target from the sMAPE target for each distribution; on Poisson counts, the two targets against the mean. The figure was drawn when the paper called the Suilin loss msMAPE, and labels it so. Drawn by lab run RN11 from the recorded results of RN10 (lab/runs/RN11/figures/msmape_targets.png).
- A56 The forecast with the lowest expected score (the target) against the share of zero actuals, on intermittent demand: one panel per family of settings (Poisson counts, negative binomial counts, lognormal demand sizes with zeros), one line per measure (sMAPE, msMAPE with nu = 0.1, 0.5 and 1, the Suilin loss). Drawn by lab run RN15 from its own results (lab/runs/RN15/figures/msmape_intermittent.png).
- A50 lognormal outcomes: relative efficiency of the sMAPE minimiser of a test set against the sample median, against test-set size, one panel per spread, with its 99% band and the large-sample value as a dashed line; below 1 the sMAPE minimiser varies more than the sample median. Drawn by lab run RN7 from its own results (lab/runs/RN7/figures/efficiency_lognormal.png).
- A51 log-Laplace outcomes: relative efficiency of the sMAPE minimiser of a test set against the sample median, against test-set size, one panel per spread, with its 99% band and the large-sample value as a dashed line; below 1 the sMAPE minimiser varies more than the sample median. Drawn by lab run RN7 from its own results (lab/runs/RN7/figures/efficiency_log-Laplace.png).
- A9 inverse Gaussian shape=1000: for each measure (RMSE, MAE, MAPE, sMAPE), one violin per test-set size showing how the candidate the measure ranks first is spread over 1000 test sets, as its quantile level, with a boxplot of its median, quartiles and 5th and 95th percentiles and a diamond at its mean; a dashed line marks the measure's preferred candidate and dotted lines the other measures'. Drawn by lab run RN1 from its own results (lab/runs/RN1/figures/inverse_Gaussian_shape=1000.png).
- A10 inverse Gaussian shape=200: for each measure (RMSE, MAE, MAPE, sMAPE), one violin per test-set size showing how the candidate the measure ranks first is spread over 1000 test sets, as its quantile level, with a boxplot of its median, quartiles and 5th and 95th percentiles and a diamond at its mean; a dashed line marks the measure's preferred candidate and dotted lines the other measures'. Drawn by lab run RN1 from its own results (lab/runs/RN1/figures/inverse_Gaussian_shape=200.png).
- A11 inverse Gaussian shape=100: for each measure (RMSE, MAE, MAPE, sMAPE), one violin per test-set size showing how the candidate the measure ranks first is spread over 1000 test sets, as its quantile level, with a boxplot of its median, quartiles and 5th and 95th percentiles and a diamond at its mean; a dashed line marks the measure's preferred candidate and dotted lines the other measures'. Drawn by lab run RN1 from its own results (lab/runs/RN1/figures/inverse_Gaussian_shape=100.png).
- A12 inverse Gaussian shape=50: for each measure (RMSE, MAE, MAPE, sMAPE), one violin per test-set size showing how the candidate the measure ranks first is spread over 1000 test sets, as its quantile level, with a boxplot of its median, quartiles and 5th and 95th percentiles and a diamond at its mean; a dashed line marks the measure's preferred candidate and dotted lines the other measures'. Drawn by lab run RN1 from its own results (lab/runs/RN1/figures/inverse_Gaussian_shape=50.png).
- A13 inverse Gaussian shape=20: for each measure (RMSE, MAE, MAPE, sMAPE), one violin per test-set size showing how the candidate the measure ranks first is spread over 1000 test sets, as its quantile level, with a boxplot of its median, quartiles and 5th and 95th percentiles and a diamond at its mean; a dashed line marks the measure's preferred candidate and dotted lines the other measures'. Drawn by lab run RN1 from its own results (lab/runs/RN1/figures/inverse_Gaussian_shape=20.png).
- A14 inverse Gaussian shape=10: for each measure (RMSE, MAE, MAPE, sMAPE), one violin per test-set size showing how the candidate the measure ranks first is spread over 1000 test sets, as its quantile level, with a boxplot of its median, quartiles and 5th and 95th percentiles and a diamond at its mean; a dashed line marks the measure's preferred candidate and dotted lines the other measures'. Drawn by lab run RN1 from its own results (lab/runs/RN1/figures/inverse_Gaussian_shape=10.png).
- A15 log-skewed left sd=0.5 skew=-2: for each measure (RMSE, MAE, MAPE, sMAPE), one violin per test-set size showing how the candidate the measure ranks first is spread over 1000 test sets, as its quantile level, with a boxplot of its median, quartiles and 5th and 95th percentiles and a diamond at its mean; a dashed line marks the measure's preferred candidate and dotted lines the other measures'. Drawn by lab run RN1 from its own results (lab/runs/RN1/figures/log-skewed_left_sd=0.5_skew=-2.png).
- A16 log-skewed left sd=0.5 skew=-1: for each measure (RMSE, MAE, MAPE, sMAPE), one violin per test-set size showing how the candidate the measure ranks first is spread over 1000 test sets, as its quantile level, with a boxplot of its median, quartiles and 5th and 95th percentiles and a diamond at its mean; a dashed line marks the measure's preferred candidate and dotted lines the other measures'. Drawn by lab run RN1 from its own results (lab/runs/RN1/figures/log-skewed_left_sd=0.5_skew=-1.png).
- A17 log-skewed left sd=0.5 skew=-0.5: for each measure (RMSE, MAE, MAPE, sMAPE), one violin per test-set size showing how the candidate the measure ranks first is spread over 1000 test sets, as its quantile level, with a boxplot of its median, quartiles and 5th and 95th percentiles and a diamond at its mean; a dashed line marks the measure's preferred candidate and dotted lines the other measures'. Drawn by lab run RN1 from its own results (lab/runs/RN1/figures/log-skewed_left_sd=0.5_skew=-0.5.png).
- A18 log-skewed right sd=0.5 skew=+2: for each measure (RMSE, MAE, MAPE, sMAPE), one violin per test-set size showing how the candidate the measure ranks first is spread over 1000 test sets, as its quantile level, with a boxplot of its median, quartiles and 5th and 95th percentiles and a diamond at its mean; a dashed line marks the measure's preferred candidate and dotted lines the other measures'. Drawn by lab run RN1 from its own results (lab/runs/RN1/figures/log-skewed_right_sd=0.5_skew=_2.png).
- A19 log-skewed right sd=0.5 skew=+1: for each measure (RMSE, MAE, MAPE, sMAPE), one violin per test-set size showing how the candidate the measure ranks first is spread over 1000 test sets, as its quantile level, with a boxplot of its median, quartiles and 5th and 95th percentiles and a diamond at its mean; a dashed line marks the measure's preferred candidate and dotted lines the other measures'. Drawn by lab run RN1 from its own results (lab/runs/RN1/figures/log-skewed_right_sd=0.5_skew=_1.png).
- A20 log-skewed right sd=0.5 skew=+0.5: for each measure (RMSE, MAE, MAPE, sMAPE), one violin per test-set size showing how the candidate the measure ranks first is spread over 1000 test sets, as its quantile level, with a boxplot of its median, quartiles and 5th and 95th percentiles and a diamond at its mean; a dashed line marks the measure's preferred candidate and dotted lines the other measures'. Drawn by lab run RN1 from its own results (lab/runs/RN1/figures/log-skewed_right_sd=0.5_skew=_0.5.png).
- A21 lognormal sigma=0.5: for each measure (RMSE, MAE, MAPE, sMAPE), one violin per test-set size showing how the candidate the measure ranks first is spread over 1000 test sets, as its quantile level, with a boxplot of its median, quartiles and 5th and 95th percentiles and a diamond at its mean; a dashed line marks the measure's preferred candidate and dotted lines the other measures'. Drawn by lab run RN1 from its own results (lab/runs/RN1/figures/lognormal_sigma=0.5.png).
- A22 log-skewed left sd=1 skew=-2: for each measure (RMSE, MAE, MAPE, sMAPE), one violin per test-set size showing how the candidate the measure ranks first is spread over 1000 test sets, as its quantile level, with a boxplot of its median, quartiles and 5th and 95th percentiles and a diamond at its mean; a dashed line marks the measure's preferred candidate and dotted lines the other measures'. Drawn by lab run RN1 from its own results (lab/runs/RN1/figures/log-skewed_left_sd=1_skew=-2.png).
- A23 log-skewed left sd=1 skew=-1: for each measure (RMSE, MAE, MAPE, sMAPE), one violin per test-set size showing how the candidate the measure ranks first is spread over 1000 test sets, as its quantile level, with a boxplot of its median, quartiles and 5th and 95th percentiles and a diamond at its mean; a dashed line marks the measure's preferred candidate and dotted lines the other measures'. Drawn by lab run RN1 from its own results (lab/runs/RN1/figures/log-skewed_left_sd=1_skew=-1.png).
- A24 log-skewed left sd=1 skew=-0.5: for each measure (RMSE, MAE, MAPE, sMAPE), one violin per test-set size showing how the candidate the measure ranks first is spread over 1000 test sets, as its quantile level, with a boxplot of its median, quartiles and 5th and 95th percentiles and a diamond at its mean; a dashed line marks the measure's preferred candidate and dotted lines the other measures'. Drawn by lab run RN1 from its own results (lab/runs/RN1/figures/log-skewed_left_sd=1_skew=-0.5.png).
- A25 log-skewed right sd=1 skew=+2: for each measure (RMSE, MAE, MAPE, sMAPE), one violin per test-set size showing how the candidate the measure ranks first is spread over 1000 test sets, as its quantile level, with a boxplot of its median, quartiles and 5th and 95th percentiles and a diamond at its mean; a dashed line marks the measure's preferred candidate and dotted lines the other measures'. Drawn by lab run RN1 from its own results (lab/runs/RN1/figures/log-skewed_right_sd=1_skew=_2.png).
- A26 log-skewed right sd=1 skew=+1: for each measure (RMSE, MAE, MAPE, sMAPE), one violin per test-set size showing how the candidate the measure ranks first is spread over 1000 test sets, as its quantile level, with a boxplot of its median, quartiles and 5th and 95th percentiles and a diamond at its mean; a dashed line marks the measure's preferred candidate and dotted lines the other measures'. Drawn by lab run RN1 from its own results (lab/runs/RN1/figures/log-skewed_right_sd=1_skew=_1.png).
- A27 log-skewed right sd=1 skew=+0.5: for each measure (RMSE, MAE, MAPE, sMAPE), one violin per test-set size showing how the candidate the measure ranks first is spread over 1000 test sets, as its quantile level, with a boxplot of its median, quartiles and 5th and 95th percentiles and a diamond at its mean; a dashed line marks the measure's preferred candidate and dotted lines the other measures'. Drawn by lab run RN1 from its own results (lab/runs/RN1/figures/log-skewed_right_sd=1_skew=_0.5.png).
- A28 lognormal sigma=1: for each measure (RMSE, MAE, MAPE, sMAPE), one violin per test-set size showing how the candidate the measure ranks first is spread over 1000 test sets, as its quantile level, with a boxplot of its median, quartiles and 5th and 95th percentiles and a diamond at its mean; a dashed line marks the measure's preferred candidate and dotted lines the other measures'. Drawn by lab run RN1 from its own results (lab/runs/RN1/figures/lognormal_sigma=1.png).
- A29 bimodal equal modes: for each measure (RMSE, MAE, MAPE, sMAPE), one violin per test-set size showing how the candidate the measure ranks first is spread over 1000 test sets, as its quantile level, with a boxplot of its median, quartiles and 5th and 95th percentiles and a diamond at its mean; a dashed line marks the measure's preferred candidate and dotted lines the other measures'. Drawn by lab run RN1 from its own results (lab/runs/RN1/figures/bimodal_equal_modes.png).
- A30 bimodal left mode higher: for each measure (RMSE, MAE, MAPE, sMAPE), one violin per test-set size showing how the candidate the measure ranks first is spread over 1000 test sets, as its quantile level, with a boxplot of its median, quartiles and 5th and 95th percentiles and a diamond at its mean; a dashed line marks the measure's preferred candidate and dotted lines the other measures'. Drawn by lab run RN1 from its own results (lab/runs/RN1/figures/bimodal_left_mode_higher.png).
- A31 bimodal right mode higher: for each measure (RMSE, MAE, MAPE, sMAPE), one violin per test-set size showing how the candidate the measure ranks first is spread over 1000 test sets, as its quantile level, with a boxplot of its median, quartiles and 5th and 95th percentiles and a diamond at its mean; a dashed line marks the measure's preferred candidate and dotted lines the other measures'. Drawn by lab run RN1 from its own results (lab/runs/RN1/figures/bimodal_right_mode_higher.png).
- A32 normal straddling zero mean=0: for each measure (RMSE, MAE, MAPE, sMAPE), one violin per test-set size showing how the candidate the measure ranks first is spread over 1000 test sets, as its quantile level, with a boxplot of its median, quartiles and 5th and 95th percentiles and a diamond at its mean; a dashed line marks the measure's preferred candidate and dotted lines the other measures'. Drawn by lab run RN1 from its own results (lab/runs/RN1/figures/normal_straddling_zero_mean=0.png).
- A33 normal straddling zero mean=0.5: for each measure (RMSE, MAE, MAPE, sMAPE), one violin per test-set size showing how the candidate the measure ranks first is spread over 1000 test sets, as its quantile level, with a boxplot of its median, quartiles and 5th and 95th percentiles and a diamond at its mean; a dashed line marks the measure's preferred candidate and dotted lines the other measures'. Drawn by lab run RN1 from its own results (lab/runs/RN1/figures/normal_straddling_zero_mean=0.5.png).
- A34 normal straddling zero mean=1: for each measure (RMSE, MAE, MAPE, sMAPE), one violin per test-set size showing how the candidate the measure ranks first is spread over 1000 test sets, as its quantile level, with a boxplot of its median, quartiles and 5th and 95th percentiles and a diamond at its mean; a dashed line marks the measure's preferred candidate and dotted lines the other measures'. Drawn by lab run RN1 from its own results (lab/runs/RN1/figures/normal_straddling_zero_mean=1.png).
- A35 lognormal sigma=0.5 with zeros p0=0.25: for each measure (RMSE, MAE, MAPE, sMAPE), one violin per test-set size showing how the candidate the measure ranks first is spread over 1000 test sets, as its quantile level, with a boxplot of its median, quartiles and 5th and 95th percentiles and a diamond at its mean; a dashed line marks the measure's preferred candidate and dotted lines the other measures'. Drawn by lab run RN1 from its own results (lab/runs/RN1/figures/lognormal_sigma=0.5_with_zeros_p0=0.25.png).
- A36 lognormal sigma=0.5 with zeros p0=0.42: for each measure (RMSE, MAE, MAPE, sMAPE), one violin per test-set size showing how the candidate the measure ranks first is spread over 1000 test sets, as its quantile level, with a boxplot of its median, quartiles and 5th and 95th percentiles and a diamond at its mean; a dashed line marks the measure's preferred candidate and dotted lines the other measures'. Drawn by lab run RN1 from its own results (lab/runs/RN1/figures/lognormal_sigma=0.5_with_zeros_p0=0.42.png).
- A37 lognormal sigma=0.5 with zeros p0=0.47: for each measure (RMSE, MAE, MAPE, sMAPE), one violin per test-set size showing how the candidate the measure ranks first is spread over 1000 test sets, as its quantile level, with a boxplot of its median, quartiles and 5th and 95th percentiles and a diamond at its mean; a dashed line marks the measure's preferred candidate and dotted lines the other measures'. Drawn by lab run RN1 from its own results (lab/runs/RN1/figures/lognormal_sigma=0.5_with_zeros_p0=0.47.png).
- A38 lognormal sigma=0.5 with zeros p0=0.6: for each measure (RMSE, MAE, MAPE, sMAPE), one violin per test-set size showing how the candidate the measure ranks first is spread over 1000 test sets, as its quantile level, with a boxplot of its median, quartiles and 5th and 95th percentiles and a diamond at its mean; a dashed line marks the measure's preferred candidate and dotted lines the other measures'. Drawn by lab run RN1 from its own results (lab/runs/RN1/figures/lognormal_sigma=0.5_with_zeros_p0=0.6.png).
- A39 lognormal sigma=1 with zeros p0=0.25: for each measure (RMSE, MAE, MAPE, sMAPE), one violin per test-set size showing how the candidate the measure ranks first is spread over 1000 test sets, as its quantile level, with a boxplot of its median, quartiles and 5th and 95th percentiles and a diamond at its mean; a dashed line marks the measure's preferred candidate and dotted lines the other measures'. Drawn by lab run RN1 from its own results (lab/runs/RN1/figures/lognormal_sigma=1_with_zeros_p0=0.25.png).
- A40 lognormal sigma=1 with zeros p0=0.37: for each measure (RMSE, MAE, MAPE, sMAPE), one violin per test-set size showing how the candidate the measure ranks first is spread over 1000 test sets, as its quantile level, with a boxplot of its median, quartiles and 5th and 95th percentiles and a diamond at its mean; a dashed line marks the measure's preferred candidate and dotted lines the other measures'. Drawn by lab run RN1 from its own results (lab/runs/RN1/figures/lognormal_sigma=1_with_zeros_p0=0.37.png).
- A41 lognormal sigma=1 with zeros p0=0.42: for each measure (RMSE, MAE, MAPE, sMAPE), one violin per test-set size showing how the candidate the measure ranks first is spread over 1000 test sets, as its quantile level, with a boxplot of its median, quartiles and 5th and 95th percentiles and a diamond at its mean; a dashed line marks the measure's preferred candidate and dotted lines the other measures'. Drawn by lab run RN1 from its own results (lab/runs/RN1/figures/lognormal_sigma=1_with_zeros_p0=0.42.png).
- A42 lognormal sigma=1 with zeros p0=0.6: for each measure (RMSE, MAE, MAPE, sMAPE), one violin per test-set size showing how the candidate the measure ranks first is spread over 1000 test sets, as its quantile level, with a boxplot of its median, quartiles and 5th and 95th percentiles and a diamond at its mean; a dashed line marks the measure's preferred candidate and dotted lines the other measures'. Drawn by lab run RN1 from its own results (lab/runs/RN1/figures/lognormal_sigma=1_with_zeros_p0=0.6.png).
- A44 The quantile level of the sMAPE target against the spread sigma of ln y, for lognormal and log-Gumbel outcomes, beside the level of the log-mode: the target moves from the median to the mode of ln y as the spread grows. Drawn by lab run RN2 from its own results (lab/runs/RN2/figures/flatness_target.png).
- A45 Expected sMAPE against the quantile level of the forecast, one curve per spread sigma, for each family: the curve flattens towards 200 as sigma grows. Drawn by lab run RN2 from its own results (lab/runs/RN2/figures/flatness_expected_sMAPE.png).
- A46 Lognormal outcomes: how much worse a forecast half a sigma or one sigma away from each measure's target scores, as a share of the score at the target, against sigma. Drawn by lab run RN2 from its own results (lab/runs/RN2/figures/flatness_sensitivity.png).
- A47 Ranking agreement: the share of test sets that prefer each measure's target to a forecast away from it, against sigma, for several test-set sizes. Drawn by lab run RN2 from its own results (lab/runs/RN2/figures/flatness_agreement.png).
- A48 Where the sMAPE minimiser of a test set falls, and how widely it spreads: its quantile level over test sets against sigma, for each family. Drawn by lab run RN2 from its own results (lab/runs/RN2/figures/flatness_minimiser.png).
| setting | derived local minimum of expected sMAPE (rank: 1) | quantile level of a derived local minimum of expected sMAPE (rank: 1) | expected sMAPE at a derived local minimum (rank: 1) | one-step quantile level of the sMAPE target | pull from above minus pull from below at the median | zero threshold of sMAPE | quantile level of the log-mode | median of the outcome distribution | mean of the outcome distribution |
|---|---|---|---|---|---|---|---|---|---|
| inverse Gaussian shape=10 | 14.02 | 0.4387 | 95.75 | 0.4362 | -0.03 | 0.3426 | 0.3471 | 17.85 | 100 |
| log-skewed left sd=1 skew=-1 | 128.3 | 0.5362 | 66.42 | 0.5365 | 0.0261 | 0.4004 | 0.6472 | 117.8 | 146 |
| log-skewed right sd=1 skew=+1 | 77.96 | 0.4638 | 66.42 | 0.4635 | -0.0261 | 0.4004 | 0.3528 | 84.88 | 216.5 |
| setting | quantile level of the preferred candidate (measure: RMSE) | quantile level of the preferred candidate (measure: MAE) | quantile level of the preferred candidate (measure: MAPE) | quantile level of the preferred candidate (measure: sMAPE) | candidates whose expected score is infinite (measure: RMSE) | candidates whose expected score is infinite (measure: MAPE) |
|---|---|---|---|---|---|---|
| inverse Gaussian shape=10 | 0.8219 | 0.5 | 0.136 | 0.4387 | 0 | 0 |
| log-skewed left sd=1 skew=-1 | 0.5928 | 0.5 | 0.0655 | 0.5362 | 0 | 0 |
| log-skewed right sd=1 skew=+1 | 0.8034 | 0.5 | 0.2314 | 0.4638 | 104 | 0 |
The tables in full, under claim C13
| setting | derived local minimum of expected sMAPE (rank: 1) | quantile level of a derived local minimum of expected sMAPE (rank: 1) | expected sMAPE at a derived local minimum (rank: 1) | one-step quantile level of the sMAPE target | pull from above minus pull from below at the median | zero threshold of sMAPE | quantile level of the log-mode | median of the outcome distribution | mean of the outcome distribution |
|---|---|---|---|---|---|---|---|---|---|
| lognormal sigma=0.5 | 100 | 0.5 | 38.38 | 0.5 | 0.0000 | 0.4469 | 0.5 | 100 | 113.3 |
| lognormal sigma=1 | 100 | 0.5 | 69.94 | 0.5 | 0.0000 | 0.394 | 0.5 | 100 | 164.9 |
| setting | quantile level of the preferred candidate (measure: RMSE) | quantile level of the preferred candidate (measure: MAE) | quantile level of the preferred candidate (measure: MAPE) | quantile level of the preferred candidate (measure: sMAPE) | candidates whose expected score is infinite (measure: RMSE) | candidates whose expected score is infinite (measure: MAPE) |
|---|---|---|---|---|---|---|
| lognormal sigma=0.5 | 0.5987 | 0.5 | 0.3085 | 0.5 | 0 | 0 |
| lognormal sigma=1 | 0.6915 | 0.5 | 0.1587 | 0.5 | 0 | 0 |
The tables in full, under claim C13
| setting | relative efficiency (test-set size: 6) | relative efficiency (test-set size: 12) | relative efficiency (test-set size: 100) | relative efficiency (test-set size: 1000) | relative efficiency (test-set size: 10000) | asymptotic relative efficiency |
|---|---|---|---|---|---|---|
| lognormal sigma=0.25 | 0.6059 | 0.7026 | 0.8996 | 0.9662 | 0.9701 | 0.9696 |
| lognormal sigma=6 | 0.3933 | 0.3027 | 0.1229 | 0.0508 | 0.0317 | 0.0279 |
| log-Laplace b=0.25 | 0.7049 | 0.8268 | 0.9769 | 0.9918 | 0.9969 | 0.9969 |
| log-Laplace b=6 | 0.4167 | 0.3492 | 0.2667 | 0.2896 | 0.3441 | 0.3753 |
The tables in full, under claim C15
| setting | derived local minimum of expected sMAPE (rank: 1) | quantile level of a derived local minimum of expected sMAPE (rank: 1) | expected sMAPE at a derived local minimum (rank: 1) | one-step quantile level of the sMAPE target | pull from above minus pull from below at the median | zero threshold of sMAPE | quantile level of the log-mode | median of the outcome distribution | mean of the outcome distribution |
|---|---|---|---|---|---|---|---|---|---|
| bimodal equal modes | 43.49 | 0.3742 | 83.84 | 0.5 | 0.0000 | 0.3674 | 0.25 | 100 | 159.2 |
| bimodal left mode higher | 39.84 | 0.4063 | 65.21 | 0.4042 | -0.0839 | 0.4026 | 0.325 | 44.22 | 122.8 |
| bimodal right mode higher | 251 | 0.5937 | 65.21 | 0.5958 | 0.0839 | 0.4026 | 0.675 | 226.1 | 195.6 |
| setting | derived local minimum of expected sMAPE (rank: 2) | quantile level of a derived local minimum of expected sMAPE (rank: 2) | expected sMAPE at a derived local minimum (rank: 2) |
|---|---|---|---|
| bimodal equal modes | 229.9 | 0.6258 | 83.84 |
| setting | quantile level of the preferred candidate (measure: RMSE) | quantile level of the preferred candidate (measure: MAE) | quantile level of the preferred candidate (measure: MAPE) | quantile level of the preferred candidate (measure: sMAPE) | candidates whose expected score is infinite (measure: RMSE) | candidates whose expected score is infinite (measure: MAPE) |
|---|---|---|---|---|---|---|
| bimodal equal modes | 0.5081 | 0.5 | 0.2341 | 0.3742 | 0 | 0 |
| bimodal left mode higher | 0.6503 | 0.5 | 0.2841 | 0.4063 | 0 | 0 |
| bimodal right mode higher | 0.4111 | 0.5 | 0.1848 | 0.5937 | 0 | 0 |
The tables in full, under claim C13
| setting | derived local minimum of expected sMAPE (rank: 1) | quantile level of a derived local minimum of expected sMAPE (rank: 1) | expected sMAPE at a derived local minimum (rank: 1) | one-step quantile level of the sMAPE target | pull from above minus pull from below at the median | zero threshold of sMAPE | quantile level of the log-mode | median of the outcome distribution | mean of the outcome distribution |
|---|---|---|---|---|---|---|---|---|---|
| lognormal sigma=0.5 with zeros p0=0.25 | 100 | 0.625 | 78.78 | 0.5 | 0.0000 | 0.4469 | 0.625 | 80.62 | 84.99 |
| lognormal sigma=0.5 with zeros p0=0.42 | 100 | 0.71 | 106.3 | 0.5 | 0.0000 | 0.4469 | 0.71 | 57.99 | 65.72 |
| lognormal sigma=0.5 with zeros p0=0.47 | 0 | 0.47 | 106 | 0.5 | 0.0000 | 0.4469 | 0.735 | 45.3 | 60.06 |
| lognormal sigma=0.5 with zeros p0=0.6 | 0 | 0.6 | 80 | 0.5 | 0.0000 | 0.4469 | 0.8 | 0 | 45.33 |
| lognormal sigma=1 with zeros p0=0.25 | 100 | 0.625 | 102.5 | 0.5 | 0.0000 | 0.394 | 0.625 | 65 | 123.7 |
| lognormal sigma=1 with zeros p0=0.37 | 100 | 0.685 | 118.1 | 0.5 | 0.0000 | 0.394 | 0.685 | 44.08 | 103.9 |
| lognormal sigma=1 with zeros p0=0.42 | 0 | 0.42 | 116 | 0.5 | 0.0000 | 0.394 | 0.71 | 33.63 | 95.63 |
| lognormal sigma=1 with zeros p0=0.6 | 0 | 0.6 | 80 | 0.5 | 0.0000 | 0.394 | 0.8 | 0 | 65.95 |
| setting | quantile level of the preferred candidate (measure: RMSE) | quantile level of the preferred candidate (measure: MAE) | quantile level of the preferred candidate (measure: MAPE) | quantile level of the preferred candidate (measure: sMAPE) | candidates whose expected score is infinite (measure: RMSE) | candidates whose expected score is infinite (measure: MAPE) |
|---|---|---|---|---|---|---|
| lognormal sigma=0.5 with zeros p0=0.25 | 0.5293 | 0.5 | 0.625 | 0 | 77 | |
| lognormal sigma=0.5 with zeros p0=0.42 | 0.5364 | 0.5 | 0.71 | 0 | 59 | |
| lognormal sigma=0.5 with zeros p0=0.47 | 0.5516 | 0.5 | 0.47 | 0 | 55 | |
| lognormal sigma=0.5 with zeros p0=0.6 | 0.6227 | 0.6 | 0.6 | 0 | 41 | |
| lognormal sigma=1 with zeros p0=0.25 | 0.6881 | 0.5 | 0.625 | 0 | 77 | |
| lognormal sigma=1 with zeros p0=0.37 | 0.6945 | 0.5 | 0.685 | 0 | 65 | |
| lognormal sigma=1 with zeros p0=0.42 | 0.6997 | 0.5 | 0.42 | 0 | 59 | |
| lognormal sigma=1 with zeros p0=0.6 | 0.7354 | 0.6 | 0.6 | 0 | 41 |
The tables in full, under claim C13
| setting | derived local minimum of expected sMAPE (rank: 1) | quantile level of a derived local minimum of expected sMAPE (rank: 1) | expected sMAPE at a derived local minimum (rank: 1) | one-step quantile level of the sMAPE target | pull from above minus pull from below at the median | zero threshold of sMAPE | quantile level of the log-mode | median of the outcome distribution | mean of the outcome distribution |
|---|---|---|---|---|---|---|---|---|---|
| normal straddling zero mean=0 | -0.753 | 0.2257 | 133.4 | 0.0000 | 0 | ||||
| normal straddling zero mean=0.5 | 0.9838 | 0.6858 | 104.5 | 0.5 | 0.5 | ||||
| normal straddling zero mean=1 | 1.287 | 0.6128 | 78.51 | 1 | 1 |
| setting | derived local minimum of expected sMAPE (rank: 2) | quantile level of a derived local minimum of expected sMAPE (rank: 2) | expected sMAPE at a derived local minimum (rank: 2) |
|---|---|---|---|
| normal straddling zero mean=0 | 0.753 | 0.7743 | 133.4 |
| normal straddling zero mean=0.5 | -0.5849 | 0.139 | 159.9 |
| normal straddling zero mean=1 | -0.4649 | 0.0715 | 179.8 |
| setting | quantile level of the preferred candidate (measure: RMSE) | quantile level of the preferred candidate (measure: MAE) | quantile level of the preferred candidate (measure: MAPE) | quantile level of the preferred candidate (measure: sMAPE) | candidates whose expected score is infinite (measure: RMSE) | candidates whose expected score is infinite (measure: MAPE) |
|---|---|---|---|---|---|---|
| normal straddling zero mean=0 | 0.5 | 0.5 | 0.5 | 0.7743 | 0 | 100 |
| normal straddling zero mean=0.5 | 0.5 | 0.5 | 0.3085 | 0.6858 | 0 | 101 |
| normal straddling zero mean=1 | 0.5 | 0.5 | 0.1587 | 0.6128 | 0 | 101 |
The tables in full, under claim C13
| setting | quantile level of the sMAPE target | quantile level of the log-mode | expected sMAPE at the target | large-spread approximation of expected sMAPE at the target | local minima of expected sMAPE |
|---|---|---|---|---|---|
| lognormal sigma=0.1 | 0.5 | 0.5 | 7.966 | -2012 | 1 |
| log-Gumbel right sigma=0.1 | 0.4989 | 0.3679 | 9.643 | -1724 | 1 |
| log-Gumbel left sigma=4 | 0.6106 | 0.6321 | 152.5 | 149.1 | 1 |
| lognormal sigma=10 | 0.5 | 0.5 | 178.2 | 177.9 | 1 |
| log-Gumbel right sigma=10 | 0.3724 | 0.3679 | 179.9 | 179.6 | 1 |
The tables in full, under claim C14
| setting | target (measure: sMAPE) | target (measure: Suilin) | quantile level of the target (measure: sMAPE) | quantile level of the target (measure: Suilin) | relative difference of the Suilin target from the sMAPE target | share of zero outcomes |
|---|---|---|---|---|---|---|
| lognormal median=1 sigma=1 | 1 | 0.9846 | 0.5 | 0.4938 | -0.0154 | 0 |
| setting | zero threshold (measure: sMAPE) | zero threshold (measure: Suilin) |
|---|---|---|
| lognormal median=1 sigma=1 | 0.394 | 0.47 |
| lognormal median=100 sigma=1 | 0.394 | 0.3937 |
The tables in full, under claim C16
| setting | share of zero outcomes | median of the outcomes | mode of the outcomes | mean of the outcomes | target (measure: sMAPE) | target (measure: msMAPE nu=0.1) | target (measure: msMAPE nu=0.5) | target (measure: msMAPE nu=1) | target (measure: Suilin) |
|---|---|---|---|---|---|---|---|---|---|
| Poisson mean=0.1 | 0.9048 | 0 | 0 | 0.1 | 0 | 0 | 0 | 0 | 0 |
| Poisson mean=0.3 | 0.7408 | 0 | 0 | 0.3 | 0 | 0 | 0 | 0 | 0 |
| Poisson mean=0.5 | 0.6065 | 0 | 0 | 0.5 | 0 | 0 | 0 | 1 | 0 |
| Poisson mean=0.7 | 0.4966 | 1 | 0 | 0.7 | 0 | 0 | 1 | 1 | 0 |
| Poisson mean=1 | 0.3679 | 1 | 0 | 1 | 1 | 1 | 1 | 1 | 1 |
| Poisson mean=1.5 | 0.2231 | 1 | 1 | 1.5 | 2 | 2 | 1 | 1 | 2 |
| Poisson mean=3 | 0.0498 | 3 | 2 | 3 | 3 | 3 | 3 | 3 | 3 |
| negative binomial mean=0.5 size=0.5 | 0.7071 | 0 | 0 | 0.5 | 0 | 0 | 0 | 0 | 0 |
| negative binomial mean=1 size=0.5 | 0.5774 | 0 | 0 | 1 | 0 | 0 | 0 | 1 | 0 |
| negative binomial mean=2 size=0.5 | 0.4472 | 1 | 0 | 2 | 0 | 0 | 1 | 1 | 0 |
| setting | zero threshold (measure: sMAPE) | zero threshold (measure: msMAPE nu=0.1) | zero threshold (measure: msMAPE nu=0.5) | zero threshold (measure: msMAPE nu=1) | zero threshold (measure: Suilin) |
|---|---|---|---|---|---|
| lognormal sizes with zeros | 0.394 | 0.4191 | 0.5192 | 0.5647 | 0.47 |
The tables in full, under claim C21
| family | spread | large-sample relative efficiency, formula |
|---|---|---|
| lognormal | 0.25 | 0.9696 |
| lognormal | 0.5 | 0.8881 |
| lognormal | 1.0 | 0.6601 |
| lognormal | 1.5 | 0.454 |
| lognormal | 2.0 | 0.3073 |
| lognormal | 3.0 | 0.1474 |
| lognormal | 4.0 | 0.0778 |
| lognormal | 6.0 | 0.0279 |
| log-Laplace | 0.25 | 0.9969 |
| log-Laplace | 0.5 | 0.9765 |
| log-Laplace | 1.0 | 0.8953 |
| log-Laplace | 1.5 | 0.8036 |
| log-Laplace | 2.0 | 0.7207 |
| log-Laplace | 3.0 | 0.5903 |
| log-Laplace | 4.0 | 0.4969 |
| log-Laplace | 6.0 | 0.3755 |
| distributions where A is not below 2 g at the median | largest difference from the asymptotic values recorded by RN7 |
|---|---|
| 0 | 0.0001 |