The claim
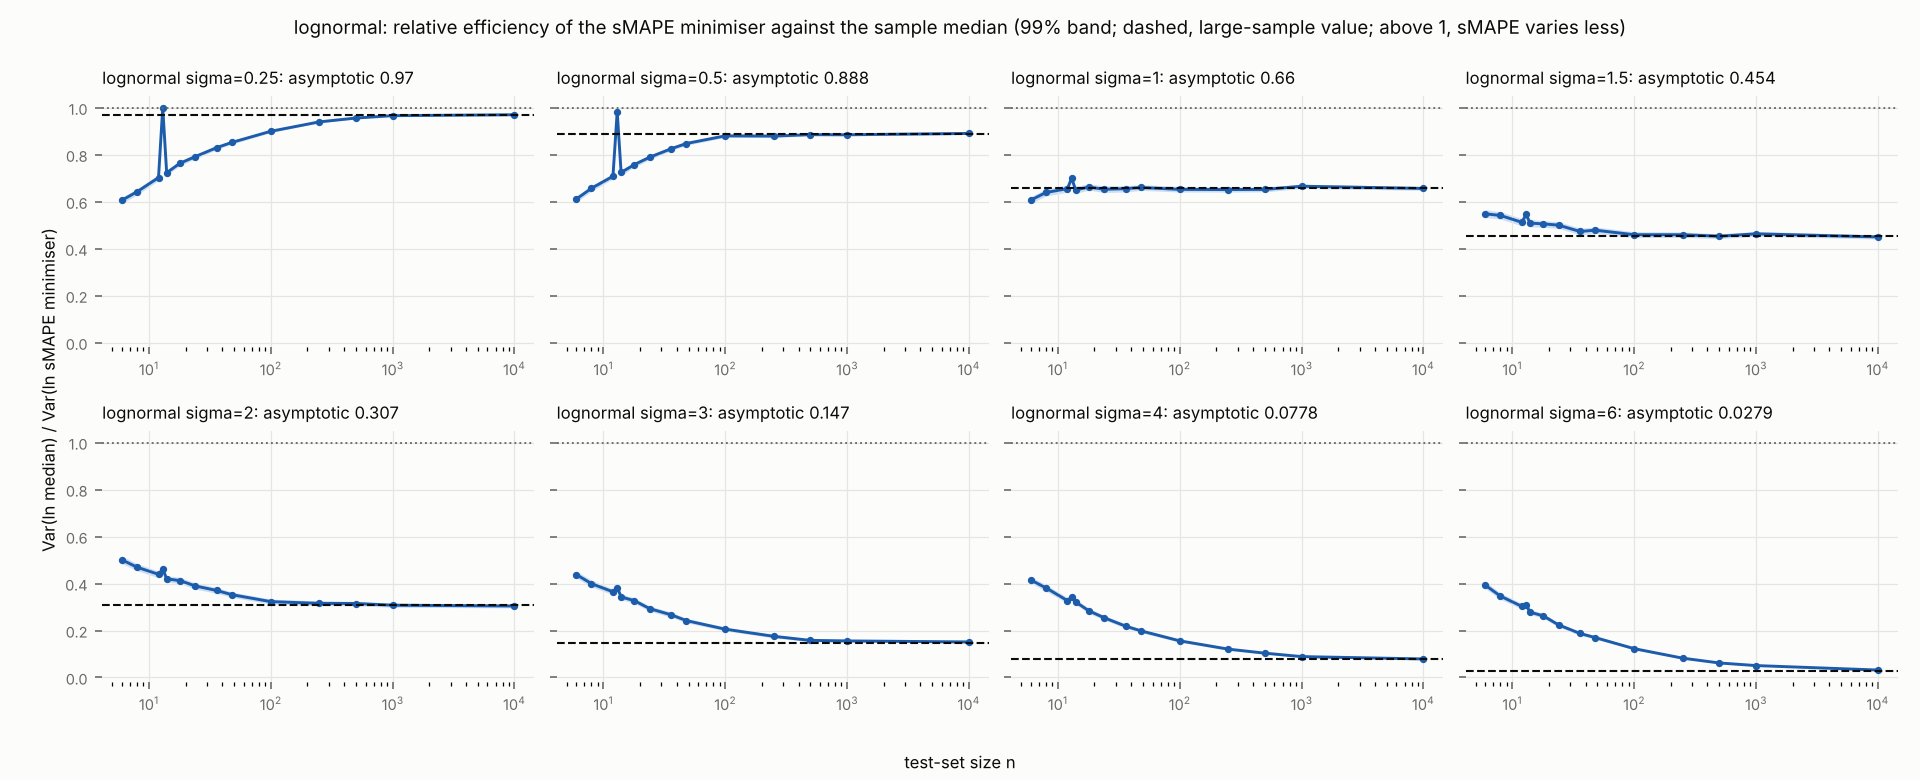
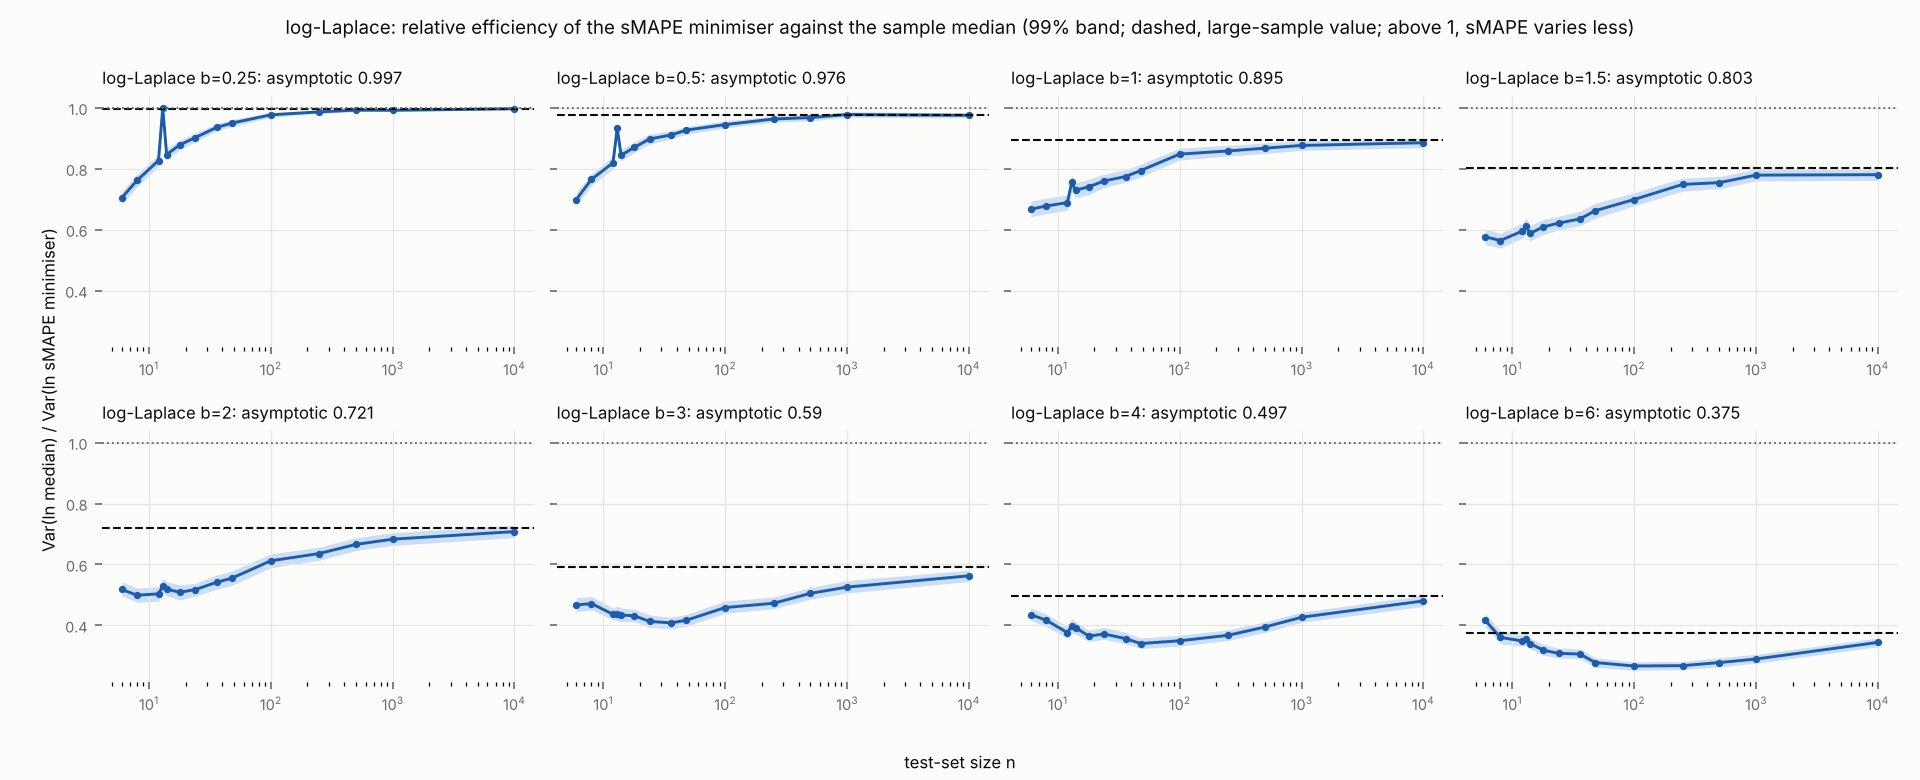
Where sMAPE and MAE both target the median (log-symmetric outcomes), the sMAPE minimiser of a test set varies more than the sample median for every spread and test-set size studied: its relative efficiency is below 1 and falls as the actuals spread out, at from 0.97 to 0.03 on lognormal actuals as grows from 0.25 to 6, and from 1.00 to 0.34 on log-Laplace actuals as grows from 0.25 to 6, close to the large-sample values.
Scope: data: test sets of independent draws from known distributions; conditions: lognormal and log-Laplace outcomes, spread 0.25 to 6, test sets of 6 to 10000 outcomes · Data: E15 (T1.r1, T1.r8, T1.r9, T1.r16) · Limitations: L2 · Supports: B7 · Supports: B6 · Supports: B13 · Qualifies: C12 · Planned: lab plan PL2, planned 16 November 2026 · Weaknesses: the code changed after the plan
Evidence
Lab runs RN7 under plan PL2. Design: Efficiency design (D17) on 16 log-symmetric distributions (D26): lognormal sigma and log-Laplace b, each 0.25, 0.5, 1, 1.5, 2, 3, 4, 6. Test sets of n = 6, 8, 12, 13, 14, 18, 24, 36, 48, 100, 250, 500, 1000 and 10000 outcomes, 10000 test sets per size, seed 4 with the setting's index and n. In each test set: the sample median and the exact sMAPE minimiser (D8). From each distribution, derived (D15): the large-sample n Var of ln of each, from H11, and their ratio. python3 claimset-code/smape-target/efficiency.py --seed 4 --reps 10000 (numpy 2.5.3, matplotlib 3.11.2). Analysis: Per distribution and n, over test sets: the variances of ln(sample median) and ln(sMAPE minimiser); the relative efficiency (D9) with a 99% bootstrap percentile interval (2000 resamples of test sets); the ratio of their mean squared errors about the true median; the mean of ln(sMAPE minimiser) minus ln(median). Per distribution: the asymptotic relative efficiency. Figure: relative efficiency over n, a panel per distribution, with its band, the asymptotic value dashed and 1 dotted. Compared with H11 and H14 (iii); no test is made and no threshold is set.
Setup: studied sMAPE minimiser of a test set, MAE · cases log-symmetric outcomes · procedure efficiency design, derived value · lens relative efficiency
| Row | setting | relative efficiency (test-set size: 6) | relative efficiency (test-set size: 12) | relative efficiency (test-set size: 100) | relative efficiency (test-set size: 1000) | relative efficiency (test-set size: 10000) | asymptotic relative efficiency |
|---|---|---|---|---|---|---|---|
| r1 | lognormal sigma=0.25 | 0.6059 | 0.7026 | 0.8996 | 0.9662 | 0.9701 | 0.9696 |
| r2 | lognormal sigma=0.5 | 0.611 | 0.7083 | 0.8802 | 0.885 | 0.8906 | 0.8881 |
| r3 | lognormal sigma=1 | 0.6067 | 0.6555 | 0.6524 | 0.6659 | 0.6565 | 0.6601 |
| r4 | lognormal sigma=1.5 | 0.5484 | 0.5123 | 0.4595 | 0.4633 | 0.45 | 0.454 |
| r5 | lognormal sigma=2 | 0.501 | 0.4392 | 0.323 | 0.3077 | 0.3043 | 0.3073 |
| r6 | lognormal sigma=3 | 0.4381 | 0.3646 | 0.2058 | 0.1557 | 0.1513 | 0.1474 |
| r7 | lognormal sigma=4 | 0.4148 | 0.3272 | 0.1561 | 0.089 | 0.0789 | 0.0778 |
| r8 | lognormal sigma=6 | 0.3933 | 0.3027 | 0.1229 | 0.0508 | 0.0317 | 0.0279 |
| r9 | log-Laplace b=0.25 | 0.7049 | 0.8268 | 0.9769 | 0.9918 | 0.9969 | 0.9969 |
| r10 | log-Laplace b=0.5 | 0.6989 | 0.819 | 0.9448 | 0.9779 | 0.9753 | 0.9765 |
| r11 | log-Laplace b=1 | 0.667 | 0.6887 | 0.8479 | 0.8763 | 0.8853 | 0.8953 |
| r12 | log-Laplace b=1.5 | 0.5766 | 0.5947 | 0.6989 | 0.7789 | 0.7804 | 0.8035 |
| r13 | log-Laplace b=2 | 0.5179 | 0.5036 | 0.612 | 0.683 | 0.7079 | 0.7206 |
| r14 | log-Laplace b=3 | 0.4672 | 0.4365 | 0.4586 | 0.5257 | 0.5628 | 0.5902 |
| r15 | log-Laplace b=4 | 0.4353 | 0.3764 | 0.3496 | 0.4267 | 0.4803 | 0.4968 |
| r16 | log-Laplace b=6 | 0.4167 | 0.3492 | 0.2667 | 0.2896 | 0.3441 | 0.3753 |
| Row | setting | test-set size | mean of ln(sMAPE minimiser) minus ln(median) | variance of ln(sample median) | variance of ln(sMAPE minimiser) | ratio of mean squared errors about the true median |
|---|---|---|---|---|---|---|
| r1 | lognormal sigma=0.25 | 12 | 0.0008 | 0.0072 | 0.0103 | 0.7026 |
| r2 | lognormal sigma=0.25 | 1000 | 0.0000 | 0.0001 | 0.0001 | 0.9662 |
| r3 | lognormal sigma=1 | 12 | 0.0008 | 0.1159 | 0.1768 | 0.6555 |
| r4 | lognormal sigma=1 | 1000 | 0.0001 | 0.0016 | 0.0024 | 0.6659 |
| r5 | lognormal sigma=6 | 12 | 0.0021 | 4.287 | 14.17 | 0.3027 |
| r6 | lognormal sigma=6 | 1000 | -0.0209 | 0.0571 | 1.126 | 0.0507 |
| r7 | log-Laplace b=0.25 | 12 | -0.0004 | 0.0073 | 0.0088 | 0.8268 |
| r8 | log-Laplace b=0.25 | 1000 | 0.0002 | 0.0001 | 0.0001 | 0.9918 |
| r9 | log-Laplace b=1 | 12 | 0.0014 | 0.1191 | 0.173 | 0.6887 |
| r10 | log-Laplace b=1 | 1000 | 0.0003 | 0.0011 | 0.0012 | 0.8764 |
| r11 | log-Laplace b=6 | 12 | 0.0212 | 4.267 | 12.22 | 0.3492 |
| r12 | log-Laplace b=6 | 1000 | 0.003 | 0.0377 | 0.1303 | 0.2896 |
Limitations
Lab run RN7 deviated from plan PL2: RN7 ran efficiency.py at commit fa0ce62, not the plan's 92cd9a5: the script runs its 16 settings in parallel processes (one per core) instead of one after another; theory.py also gained a function (balance_exact) that efficiency.py does not use. Each (setting, test-set size) draws from its own seed as before, and on a subset the parallel code and the plan's code gave byte-identical results.json. Reason: Three earlier attempts on one core (over an hour) were killed by container restarts before the lab recorded them (notes NT2.R2, NT5, NT6); in parallel the run finished in about 20 minutes. The analysis, the settings, the seeds and the results are unchanged.
Definitions
Methods 1
D17 efficiency design: For each outcome distribution and test-set size : draw test sets of independent outcomes; in each, compute the sample median and the exact sMAPE minimiser (an outcome of the test set, since the test set's sMAPE is concave in between consecutive outcomes); over test sets, compare the variances of their logarithms.
Variables and measures 3
D11 MAE: Mean absolute error of a point forecast over a test set of actuals : .
D8 sMAPE minimiser of a test set: The forecast that minimises the sMAPE of one test set , , found numerically (the sample counterpart of the sMAPE target).
D9 relative efficiency: For a test-set size and an outcome distribution where sMAPE and MAE both target the median: over test sets, where is the sample median (the MAE minimiser) and the sMAPE minimiser of the same test set. Above 1, sMAPE's minimiser varies less; below 1, MAE's does.
Populations 1
D26 log-symmetric outcomes: Lognormal outcomes with , and log-Laplace outcomes with scale , each 0.25, 0.5, 1, 1.5, 2, 3, 4 or 6, median 100: symmetric and strictly unimodal, so that sMAPE and MAE both target the median (C5).
Concepts 2
D6 sMAPE target: The value or values of that minimise expected sMAPE for a given distribution of the actual , : the functional sMAPE rewards. It may be a single value or several.
D15 derived value: A value computed from the outcome distribution itself by numerical integration of its density (Gauss-Legendre quadrature and a convolution on a grid of 524288 points of ), never from a sample: the expected scores, the local minima of expected sMAPE, the formulas of the hypotheses.
Context
- Supports B7 · from C15
- C11 found sMAPE's choices in short test sets spreading more than MAE's; C15 measures the loss of precision for test sets of 6 to 10000 outcomes.
- Supports B6 · from C15
- C6 recommends against sMAPE for point forecasts; C15 shows that even where it targets the median it estimates it less precisely than the sample median.
- Supports B13 · from C15
- Kolassa (2026) concludes that sMAPE should not be used; C15 shows that even where it targets the median it estimates it less precisely than the sample median.
Artefacts
- A6 · data Every result of the lab record (17182 results of 17 runs) at full precision: the lab result's ID, its run, the quantity as the run's script named it, its conditions and its value (both as JSON). The evidence's tables give the values to four significant digits. smape-target.results.csv
- A49 · data Every result of lab run RN7 (PL2: efficiency of the sMAPE minimiser against the sample median) at full precision, one row per result, sorted by setting: the lab result's ID, its run, the quantity, its conditions and its value (both as JSON). The evidence's tables give selected values to four significant digits. smape-target.RN7.results.csv
- A50 · figure · data_plot lognormal outcomes: relative efficiency of the sMAPE minimiser of a test set against the sample median, against test-set size, one panel per spread, with its 99% band and the large-sample value as a dashed line; below 1 the sMAPE minimiser varies more than the sample median. Drawn by lab run RN7 from its own results (lab/runs/RN7/figures/efficiency_lognormal.png). RN7-efficiency_lognormal.png
- A51 · figure · data_plot log-Laplace outcomes: relative efficiency of the sMAPE minimiser of a test set against the sample median, against test-set size, one panel per spread, with its 99% band and the large-sample value as a dashed line; below 1 the sMAPE minimiser varies more than the sample median. Drawn by lab run RN7 from its own results (lab/runs/RN7/figures/efficiency_log-Laplace.png). RN7-efficiency_log-Laplace.png
Score
Scores are computed by rules from the claimset file (EntryLib rubric 0.7): they check the record, not the science, and may change as the rubric and reviews develop. The rubric.
C15: 89, Well supported
Novelty: new, by the authors
- −6 Open problems Limitation L2 (could bias magnitude, not mitigated): Lab run RN7 deviated from plan PL2: RN7 ran efficiency.py at commit fa0ce62, not the plan's 92cd9a5: the script runs its 16 settings in parallel processes (one per core) instead of one after another; theory.py also gained a function (balance_exact) that efficiency.py does not use. Each (setting, test-set size) draws from its own seed as before, and on a subset the parallel code and the plan's code gave byte-identical results.json. Reason: Three earlier attempts on one core (over an hour) were killed by container restarts before the lab recorded them (notes NT2.R2, NT5, NT6); in parallel the run finished in about 20 minutes. The analysis, the settings, the seeds and the results are unchanged. To remove it: Mitigate it with evidence, or narrow the claim's scope so that it no longer applies.
- −3 Plan The lab record flags the test: code changed after plan. To remove it: Rerun the test as planned, or explain the flag in a limitation.
- −1 Open problems Limitation L3 (reduces transferability, not mitigated): The test sets are independent draws from a fixed distribution. Real forecast errors are often correlated and their distribution can change over a test period, so a real test set carries less information than the same number of outcomes here. To remove it: Mitigate it with evidence, or narrow the claim's scope so that it no longer applies.
- −1 Open problems Limitation L4 (reduces transferability, not mitigated): Only the distribution families studied were computed; the formal claims (C4, C10) say what holds beyond them, the simulations only illustrate it. To remove it: Mitigate it with evidence, or narrow the claim's scope so that it no longer applies.