The claim
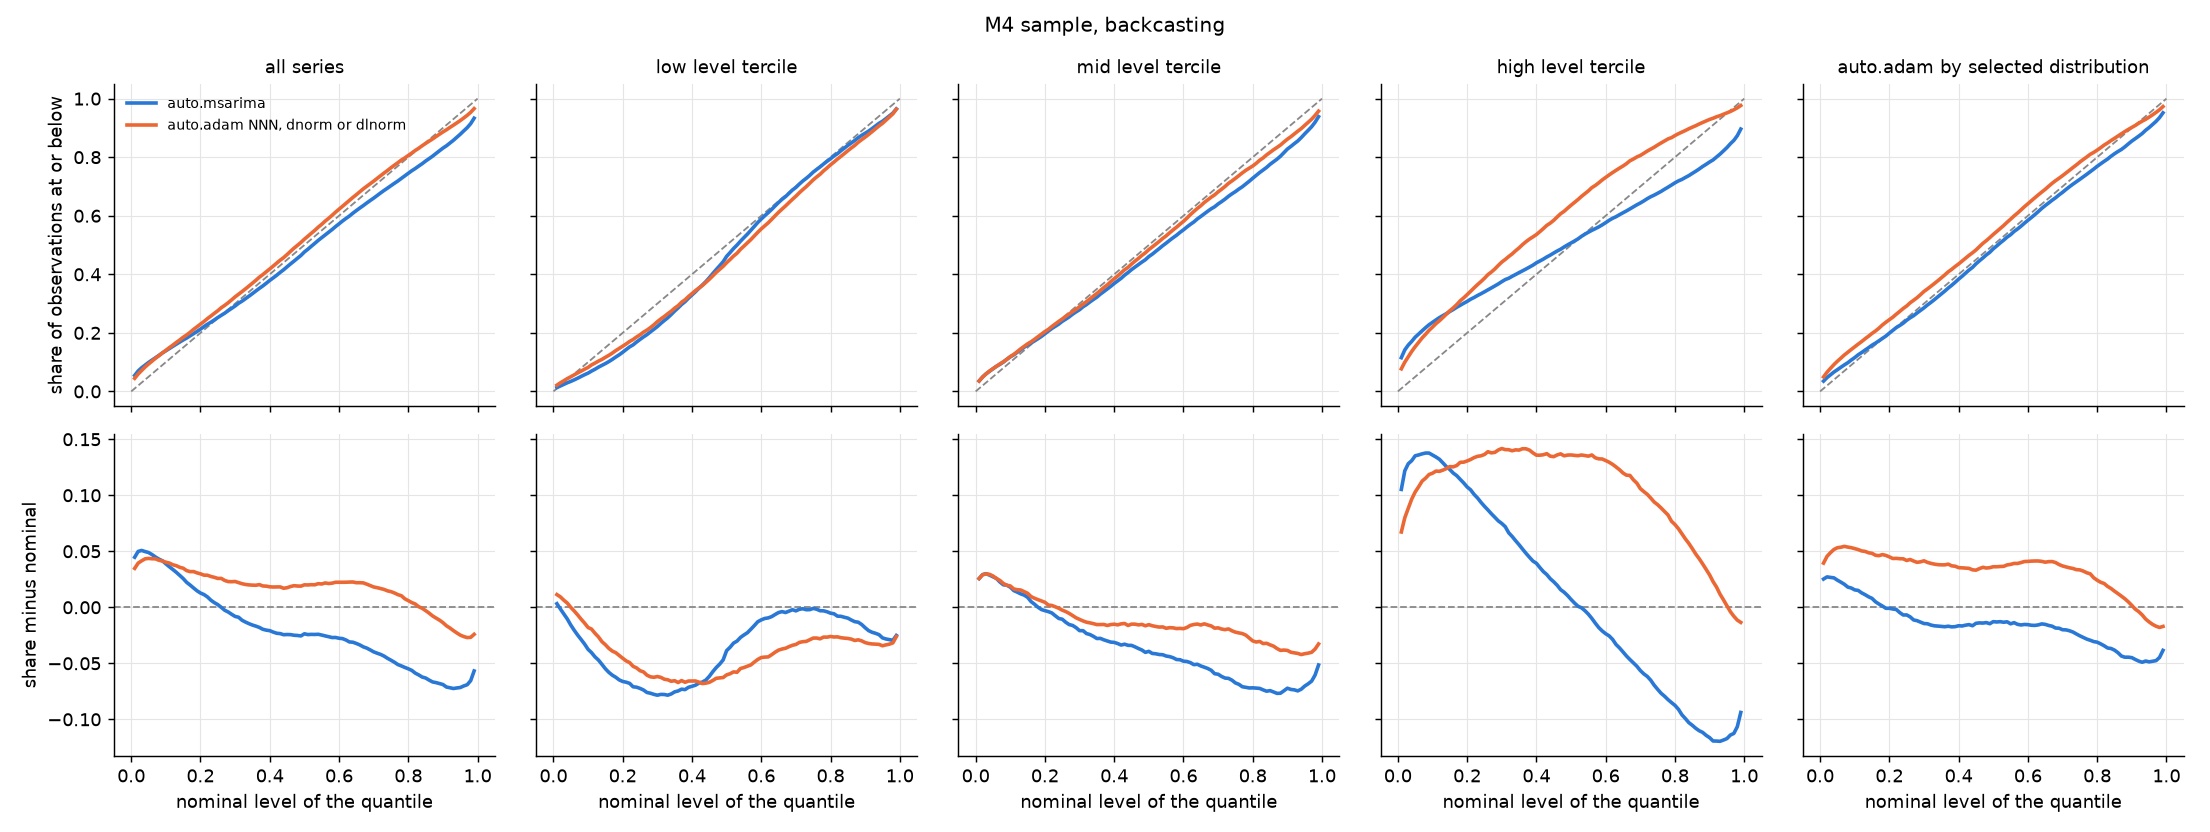
On the fresh M4 sample, auto.adam error selection lowers MCE from 0.0352 to 0.0224 and the spread of 80% coverage over the level terciles from 0.272 to 0.077 against R auto.msarima (AutoMSARIMA), short of the planned reduction of MCE to 0.6 times that of auto.msarima, so the planned test is inconclusive.
Scope: data: M4 yearly, quarterly and monthly series; conditions: backcasting, R smooth 4.6 · Data: E12 (T1.r1, T1.r2), artefacts A6 · Limitations: L5, L6 · Planned: lab plan PL15, planned 9 November 2026 · Outcome: computed from the recorded results
Evidence
R auto.msarima (AutoMSARIMA) and auto.adam error selection fitted to the 4,500 series of the fresh M4 sample with backcasting; 99 quantiles per series scored on the M4 holdouts; MCE, cov80 by level terciles, scaled pinball, and the share of series choosing dlnorm (run RN48, plan PL15, which repeats PL14 after its failed run).
Setup: studied auto.adam error selection, AutoMSARIMA · cases fresh M4 sample · procedure level terciles · lens coverage, MCE, scaled pinball, level ratio
| Row | method | coverage (nominal level: 0.8) | MCE | scaled pinball (median) | coverage (nominal level: 0.8, level terciles: low) | coverage (nominal level: 0.8, level terciles: mid) | coverage (nominal level: 0.8, level terciles: high) | range of the 80% coverage over the level terciles | share of series for which dlnorm is selected |
|---|---|---|---|---|---|---|---|---|---|
| r1 | auto.adam error selection | 0.7461 | 0.0224 | 0.7514 | 0.7865 | 0.7425 | 0.7092 | 0.0773 | 0.6702 |
| r2 | AutoMSARIMA | 0.6923 | 0.0352 | 0.6872 | 0.8193 | 0.7098 | 0.5477 | 0.2715 |
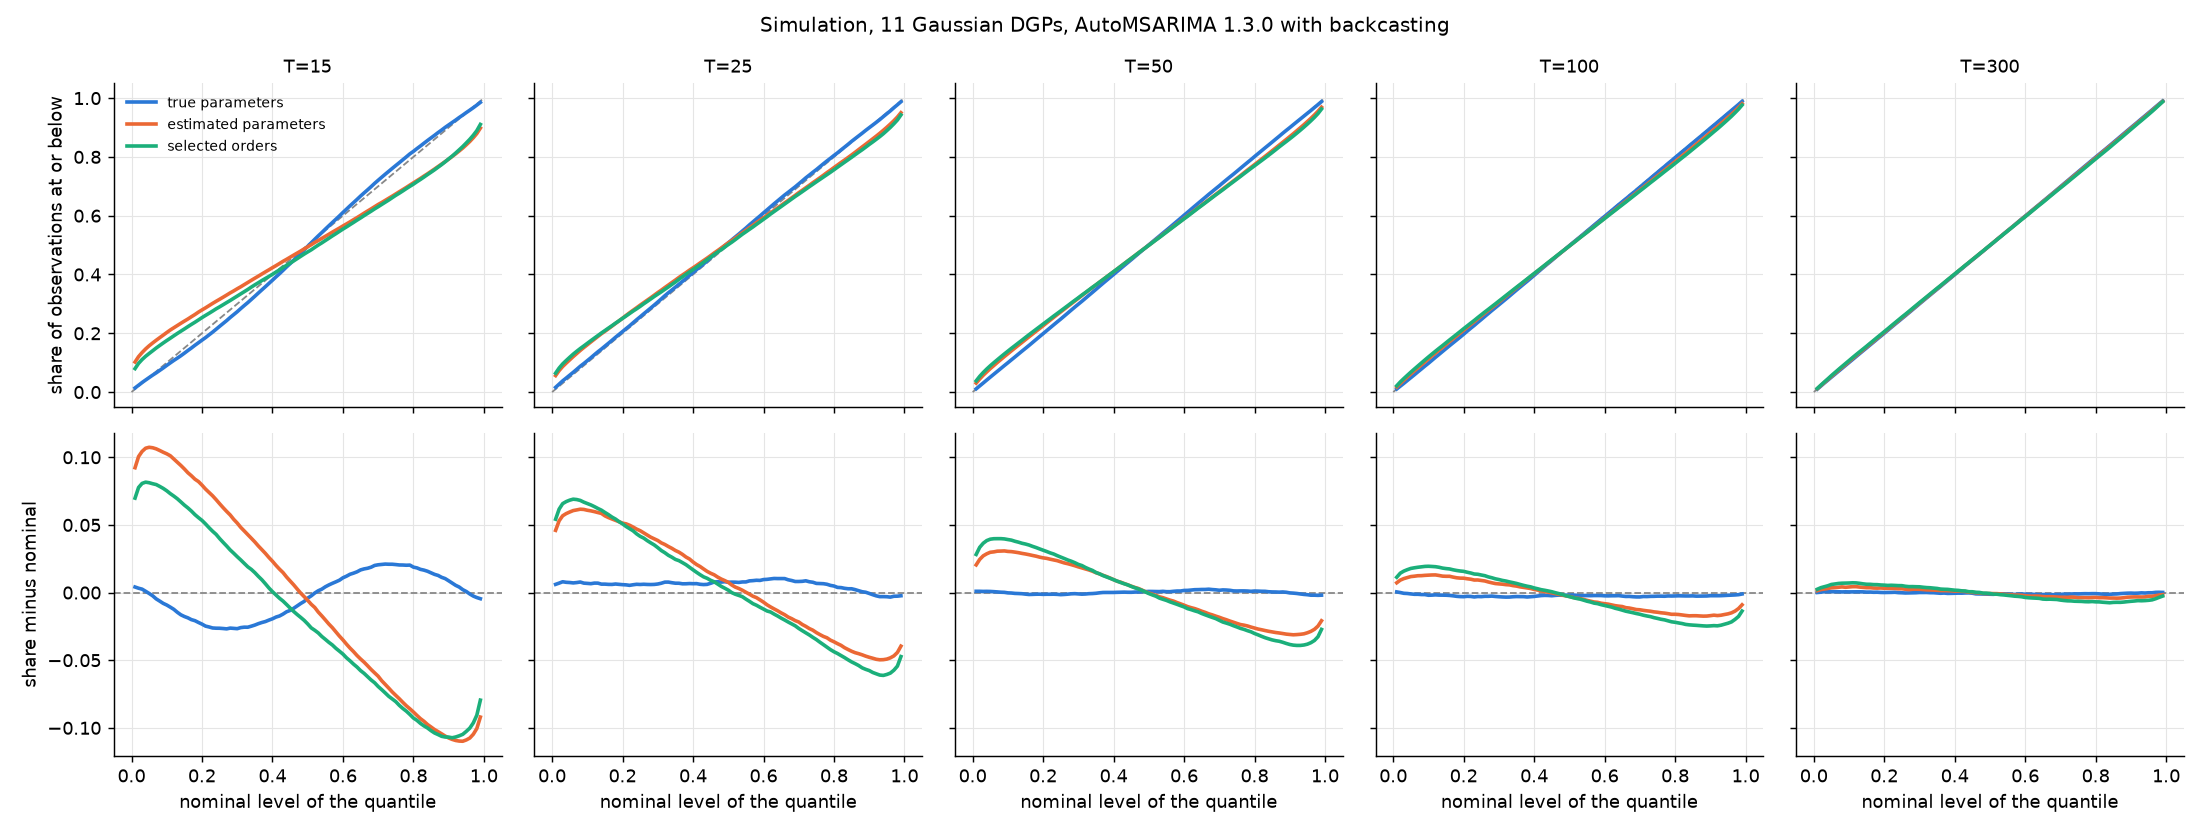
MCE of each calibration curve of the 99 quantiles drawn from recorded outputs: the known-model simulation (runs RN8, RN11, RN39), smooth 1.0.8 and 1.3.0 (RN16, RN19, RN43, RN44), the benchmark (RN45 and the saved ETS benchmark) and the fresh M4 sample (RN48), overall and by level terciles (exploratory run RN49).
Setup: studied AutoMSARIMA, auto.adam error selection, ETS forced and selected · cases known-model simulation, benchmark, fresh M4 sample · procedure level terciles · lens MCE
| Row | panel | line | MCE |
|---|---|---|---|
| r1 | T=15 | true parameters | 0.0144 |
| r2 | T=15 | estimated parameters | 0.0653 |
| r3 | T=15 | selected orders | 0.0579 |
| r4 | T=25 | true parameters | 0.0064 |
| r5 | T=25 | estimated parameters | 0.0341 |
| r6 | T=25 | selected orders | 0.0366 |
| r7 | T=50 | true parameters | 0.001 |
| r8 | T=50 | estimated parameters | 0.0196 |
| r9 | T=50 | selected orders | 0.0235 |
| r10 | T=100 | true parameters | 0.0023 |
| r11 | T=100 | estimated parameters | 0.01 |
| r12 | T=100 | selected orders | 0.0139 |
| r13 | T=300 | true parameters | 0.0007 |
| r14 | T=300 | estimated parameters | 0.0026 |
| r15 | T=300 | selected orders | 0.0046 |
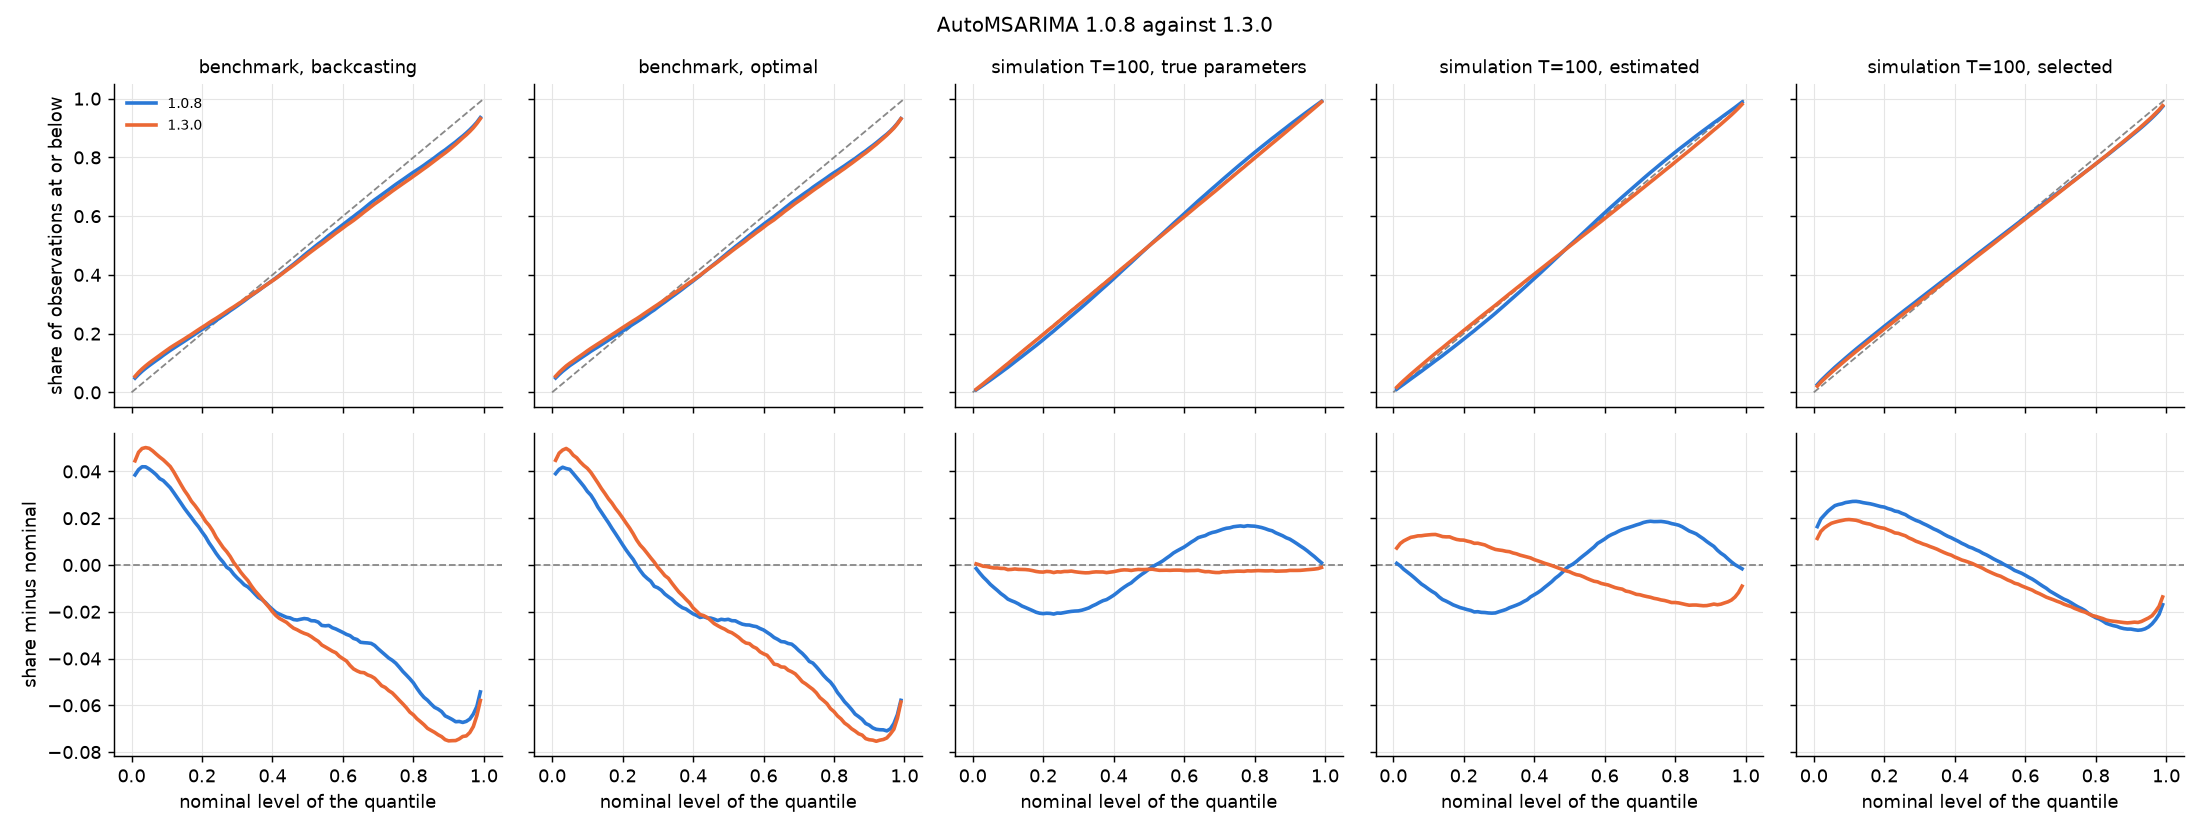
| Row | panel | line | MCE |
|---|---|---|---|
| r1 | benchmark, backcasting | 1.0.8 | 0.0326 |
| r2 | benchmark, backcasting | 1.3.0 | 0.0402 |
| r3 | benchmark, optimal | 1.0.8 | 0.0331 |
| r4 | benchmark, optimal | 1.3.0 | 0.039 |
| r5 | simulation T=100, true parameters | 1.0.8 | 0.0123 |
| r6 | simulation T=100, true parameters | 1.3.0 | 0.0023 |
| r7 | simulation T=100, estimated | 1.0.8 | 0.012 |
| r8 | simulation T=100, estimated | 1.3.0 | 0.01 |
| r9 | simulation T=100, selected | 1.0.8 | 0.0172 |
| r10 | simulation T=100, selected | 1.3.0 | 0.0139 |
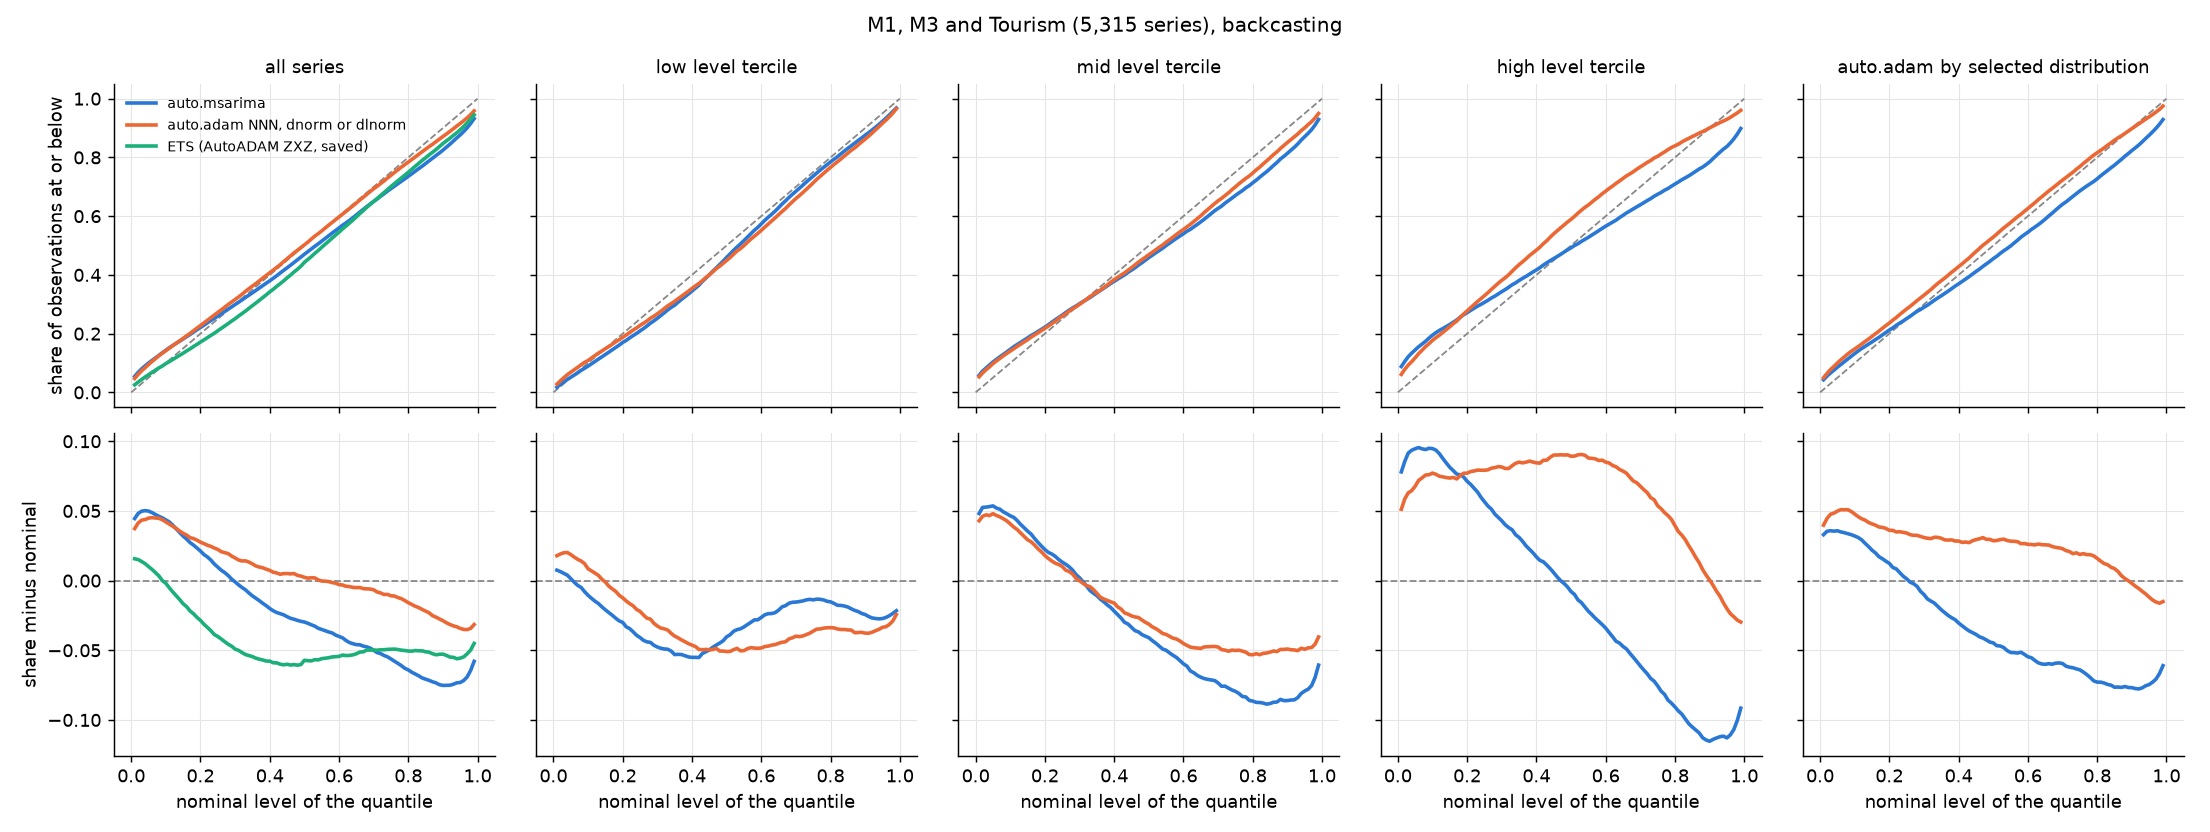
| Row | panel | line | MCE |
|---|---|---|---|
| r1 | all series | AutoMSARIMA | 0.0402 |
| r2 | all series | auto.adam error selection | 0.0187 |
| r3 | all series | ETS (AutoADAM ZXZ, saved) | 0.0442 |
| r4 | low level tercile | AutoMSARIMA | 0.0281 |
| r5 | low level tercile | auto.adam error selection | 0.0334 |
| r6 | mid level tercile | AutoMSARIMA | 0.0505 |
| r7 | mid level tercile | auto.adam error selection | 0.0352 |
| r8 | high level tercile | AutoMSARIMA | 0.0623 |
| r9 | high level tercile | auto.adam error selection | 0.0655 |
| r10 | auto.adam by selected distribution | chose dnorm | 0.0442 |
| r11 | auto.adam by selected distribution | chose dlnorm | 0.0272 |
| Row | panel | line | MCE |
|---|---|---|---|
| r1 | all series | AutoMSARIMA | 0.0352 |
| r2 | all series | auto.adam error selection | 0.0224 |
| r3 | low level tercile | AutoMSARIMA | 0.0348 |
| r4 | low level tercile | auto.adam error selection | 0.041 |
| r5 | mid level tercile | AutoMSARIMA | 0.0412 |
| r6 | mid level tercile | auto.adam error selection | 0.02 |
| r7 | high level tercile | AutoMSARIMA | 0.0757 |
| r8 | high level tercile | auto.adam error selection | 0.1052 |
| r9 | auto.adam by selected distribution | chose dnorm | 0.0209 |
| r10 | auto.adam by selected distribution | chose dlnorm | 0.0351 |
Limitations
The auto.adam comparison ran in R, because Python's AutoADAM removes dlnorm from the candidate distributions of a pure ARIMA whatever the user passes, while R's auto.adam removes it only from its default list.
The thresholds of plan PL15 were fixed after the exploratory benchmark run of auto.adam (RN45) was seen, on M4 series that run did not use.
Definitions
Methods 5
D1 MSARIMA analytic interval: The quantiles of predict(interval="prediction") of a pure ARIMA in smooth 1.3.0, which dispatches to the approximate interval. The ARIMA is the state space model
The quantile at level and horizon is
with
where is the number of estimated parameters and the -th diagonal element of the analytic covariance of the state space model, written here for a model with lag 1. Source: Svetunkov (2023).
D8 auto.adam error selection: R auto.adam(y, model="NNN", lags, distribution=c("dnorm","dlnorm"), initial="backcasting") of smooth 4.6: the ARIMA orders and constant are selected by AICc for each distribution with the maxima of auto.msarima (AR (3,3), I (2,1), MA (3,3)), then the distribution with the lower AICc is kept; with dnorm the model is the AutoMSARIMA model, with dlnorm it is the log-normal ARIMA. Quantiles from forecast(interval="prediction"). Source: Svetunkov (2023).
D10 AutoMSARIMA: AutoMSARIMA(lags, initial) in Python and auto.msarima() in R of smooth 1.3.0 / 4.6: ARIMA orders up to AR (3,3), I (2,1), MA (3,3) and a constant selected by AICc, normal errors, the MSARIMA analytic interval for the quantiles. Backcasting initial states unless stated. Source: Svetunkov (2023).
D11 log-normal ARIMA: ADAM with model="NNN", an ARIMA and distribution="dlnorm": the ARIMA applies to the logarithms,
so the scale of the error is proportional to the level. In the comparisons with fixed orders, the orders and constant are those AutoMSARIMA selects on the same series. Source: Svetunkov (2023).
D15 ETS forced and selected: ETS of smooth with backcasting: AutoADAM-style selection among ETS models (ES(model="ZXZ"), or ZXN for non-seasonal series), or ETS(ANN) or ETS(MNN) fitted to every series. Source: Svetunkov (2023).
Data 7
D2 known-model simulation: Gaussian ARIMA series with generated from 11 data generating processes (white noise with a constant, random walk with and without drift, AR(1), MA(1), ARIMA(0,1,1), ARIMA(1,1,0), ARIMA(1,1,1), ARIMA(0,2,2), seasonal SARIMA(0,1,1)(0,1,1) and SARIMA(1,0,0)(1,0,0)) plus an IMA(1,1) with Student-t errors on 4 degrees of freedom; in-sample lengths of 15, 25, 50, 100 and 300, holdout of 18; 2,000 replicates per process and length with seed 20261105 unless stated.
D5 benchmark: The 5,315 series of M1 (1,001), M3 (3,003) and Tourism (1,311) from fcompdata 0.1.4, with their own holdouts and seasonal periods; lags for seasonal series. Members: D18, D19, D20.
D6 M4 sample: 1,500 series each of the yearly, quarterly and monthly M4 series, drawn with seed 20261105 without replacement, with the M4 holdouts. Source: Makridakis et al. (2020).
D9 fresh M4 sample: 1,500 series each of the yearly, quarterly and monthly M4 series, drawn with seed 20261107 from the series not in the M4 sample, so disjoint from it. Source: Makridakis et al. (2020).
D18 M1: The 1,001 series of the M1 competition with their holdouts. Source: Makridakis et al. (1982).
D19 M3: The 3,003 series of the M3 competition with their holdouts. Source: Makridakis and Hibon (2000).
D20 Tourism: The 1,311 series of the tourism forecasting competition with their holdouts. Source: Athanasopoulos et al. (2011).
Variables and measures 4
D4 coverage: For the quantile at level and horizon , the share of holdout observations at or below it, averaged first within a series and then over series. cov80 is , the coverage of the central 80% interval; q50 is .
D13 MCE: Mean calibration error over the 99 quantile levels : with the coverage of .
D14 scaled pinball: Pinball loss averaged over the 99 quantile levels and the horizons, divided by the mean absolute first difference of the in-sample data for real series; in the simulation, by , and relpin is its ratio to the pinball of the true predictive distribution.
D17 level ratio: Mean of the last third of the in-sample data of a series divided by the mean of all its in-sample data.
Study design 1
D7 level terciles: Series split into terciles of the level ratio across the series of a data set; cov80 reported for each tercile, and the spread as the largest minus the smallest of the three.
Settings 1
D21 smooth 1.0.8 and 1.3.0: Python smooth at tag v1.0.8-py (a separate worktree with its own environment) and at 1.3.0 (commit 634657d8 of openforecast-org/smooth).
References
- Makridakis et al. (1982) Makridakis, S., Andersen, A., Carbone, R., Fildes, R., Hibon, M., Lewandowski, R., Newton, J., Parzen, E., & Winkler, R. (1982). The accuracy of extrapolation (time series) methods: Results of a forecasting competition. Journal of Forecasting, 1(2), 111–153. doi:10.1002/for.3980010202 Used by: D18
- Makridakis and Hibon (2000) Makridakis, S., & Hibon, M. (2000). The M3-Competition: results, conclusions and implications. International Journal of Forecasting, 16(4), 451–476. doi:10.1016/S0169-2070(00)00057-1 Used by: D19
- Athanasopoulos et al. (2011) Athanasopoulos, G., Hyndman, R. J., Song, H., & Wu, D. C. (2011). The tourism forecasting competition. International Journal of Forecasting, 27(3), 822–844. doi:10.1016/j.ijforecast.2010.04.009 Used by: D20
- Makridakis et al. (2020) Makridakis, S., Spiliotis, E., & Assimakopoulos, V. (2020). The M4 Competition: 100,000 time series and 61 forecasting methods. International Journal of Forecasting, 36(1), 54–74. doi:10.1016/j.ijforecast.2019.04.014 Used by: D6, D9
- Svetunkov (2023) Svetunkov, I. (2023). Forecasting and Analytics with the Augmented Dynamic Adaptive Model (ADAM). Chapman and Hall/CRC. doi:10.1201/9781003452652 Used by: D1, D8, D10, D11, D15
Artefacts
- A3 · figure · data_plot Calibration curves of the 99 quantiles in the known-model simulation, cases T, E and S, at T = 15, 25, 50, 100, 300: coverage of each quantile (top) and coverage minus level (bottom).
- A4 · figure · data_plot Calibration curves of the 99 quantiles of AutoMSARIMA 1.0.8 and 1.3.0 on the benchmark (backcasting, optimal) and in the simulation at T = 100.
- A5 · figure · data_plot Calibration curves of the 99 quantiles on the 5,315 benchmark series: auto.msarima, auto.adam with error selection and the selected ETS, overall, by level tercile and by the distribution auto.adam chose.
- A6 · figure · data_plot Calibration curves of the 99 quantiles on the fresh M4 sample: auto.msarima and auto.adam with error selection, overall, by level tercile and by the distribution auto.adam chose.
- A7 · lab_record Lab record of the study (branch claimset/msarima-interval-calibration): questions, hypotheses, plans, approvals, runs, results and notes as an append-only, hash-chained event log (lab record 0.20, claimset 0.39.0).
- A10 · data Every result recorded in the lab record (A7), one row per result: the lab result ID, the run that produced it, the quantity as the analysis script names it, its conditions as JSON and its full-precision value. The tables of the evidence objects hold these values rounded to four significant digits and at least four decimals.
Score
Scores are computed by rules from the claimset file (EntryLib rubric 0.2): they check the record, not the science, and may change as the rubric and reviews develop. The rubric.
C5: 79, Medium
Novelty: new, by the authors · no close match on EntryLib
- −12 Open problems Limitation L6 (could bias magnitude, not mitigated): The thresholds of plan PL15 were fixed after the exploratory benchmark run of auto.adam (RN45) was seen, on M4 series that run did not use. To remove it: Mitigate it with evidence, or narrow the claim's scope so that it no longer applies.
- −5 Context A principal claim related to no earlier work. To remove it: Relate the claim to the earlier work it extends, addresses or departs from.
- −3 Plan The plan's time is anchored by a git push only. To remove it: Anchor plans with the platform, a timestamp authority (RFC 3161) or a registry.
- −1 Open problems Limitation L5 (reduces transferability, not mitigated): The auto.adam comparison ran in R, because Python's AutoADAM removes dlnorm from the candidate distributions of a pure ARIMA whatever the user passes, while R's auto.adam removes it only from its default list. To remove it: Mitigate it with evidence, or narrow the claim's scope so that it no longer applies.