In brief
- 94With the true orders and true parameters, the MSARIMA analytic interval is calibrated over the 99 quantiles in the known-model simulation at of 100 and 300: MCE lies between 0.0007 and 0.0024 and the ratio of the interval width to the theoretical width between 0.9965 and 1.0019, with backcasting and with optimal initial states. C1
- 83On the M4 sample, the 80% coverage of AutoMSARIMA falls with the level ratio: 0.813, 0.700 and 0.554 from the lowest to the highest of the level terciles, while ETS(MNN) of ETS forced and selected, whose error scale follows the level, covers 0.764, 0.778 and 0.814. C2
- 78On the M4 sample, the log-normal ARIMA with the orders AutoMSARIMA selects removes the fall of 80% coverage over the level terciles (0.774, 0.783 and 0.752, a spread of 0.031) and lowers MCE from 0.0386 to 0.0177. C3
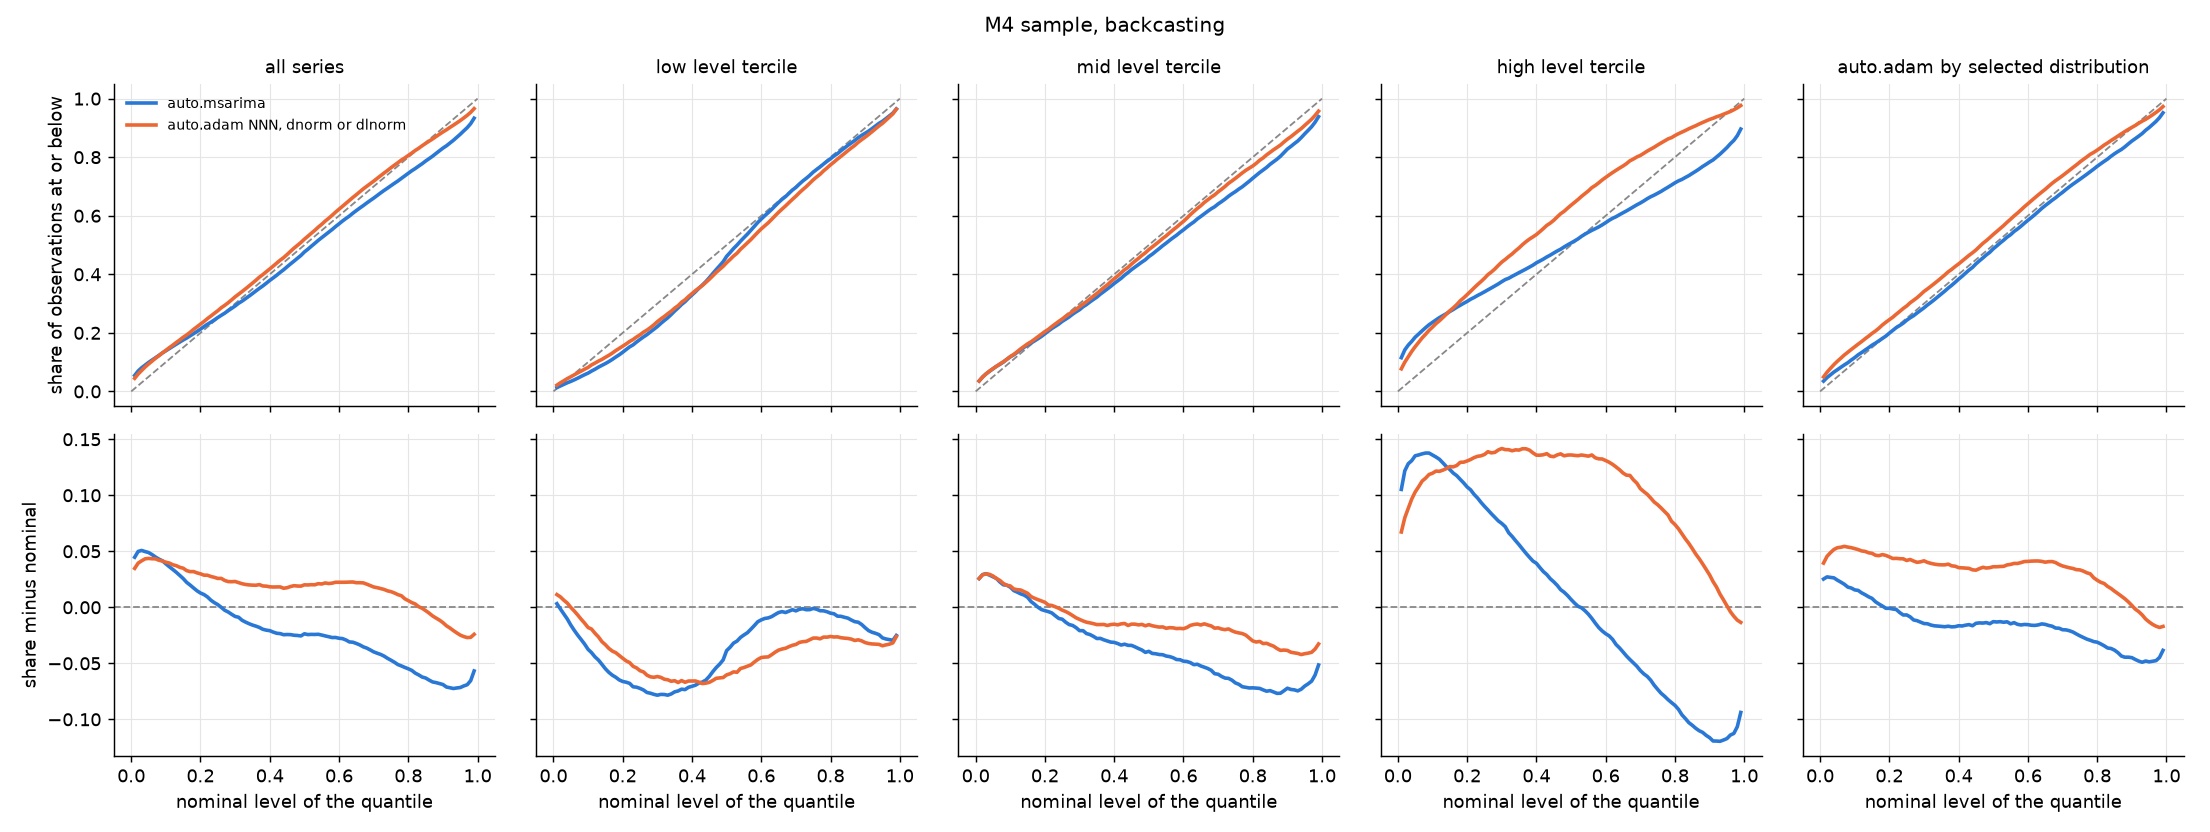
- 79On the fresh M4 sample, auto.adam error selection lowers MCE from 0.0352 to 0.0224 and the spread of 80% coverage over the level terciles from 0.272 to 0.077 against R auto.msarima (AutoMSARIMA), short of the planned reduction of MCE to 0.6 times that of auto.msarima, so the planned test is inconclusive. C5
Context
- Addresses Svetunkov (2023) · from C1
- The book derives the interval; this checks the implementation of smooth 1.3.0 against it.
- Addresses Chatfield (1993) · from C2
- Chatfield discusses why intervals are too narrow in general; this locates the shortfall of one implementation on series whose level has grown.
- Addresses Svetunkov (2023) · from C7
- Checks that the analytic variance of the implementation matches simulation from the same model.
- Extends Chatfield (1993) · from C13
- Chatfield lists model selection among the reasons intervals are too narrow; this measures it for AutoMSARIMA.
- Extends Chatfield (1993) · from C14
- Chatfield attributes narrow intervals partly to ignored parameter uncertainty; this sizes the effect at T = 100.
- Addresses Svetunkov (2023) · from C15
- The book proposes reforecasting to include parameter uncertainty; this tests the implementation for ARIMA.
- Extends Chatfield (1993) · from C21
- Sizes the effect of estimation and selection on short series for one implementation.
Definitions
Methods 7
D1 MSARIMA analytic interval: The quantiles of predict(interval="prediction") of a pure ARIMA in smooth 1.3.0, which dispatches to the approximate interval. The ARIMA is the state space model , , . The quantile at level and horizon is with , where , the number of estimated parameters and the -th diagonal element of the analytic covariance of the state space model, for a model with lag 1. Source: Svetunkov (2023).
D8 auto.adam error selection: R auto.adam(y, model="NNN", lags, distribution=c("dnorm","dlnorm"), initial="backcasting") of smooth 4.6: the ARIMA orders and constant are selected by AICc for each distribution with the maxima of auto.msarima (AR (3,3), I (2,1), MA (3,3)), then the distribution with the lower AICc is kept; with dnorm the model is the AutoMSARIMA model, with dlnorm it is the log-normal ARIMA. Quantiles from forecast(interval="prediction"). Source: Svetunkov (2023).
D10 AutoMSARIMA: AutoMSARIMA(lags, initial) in Python and auto.msarima() in R of smooth 1.3.0 / 4.6: ARIMA orders up to AR (3,3), I (2,1), MA (3,3) and a constant selected by AICc, normal errors, the MSARIMA analytic interval for the quantiles. Backcasting initial states unless stated. Source: Svetunkov (2023).
D11 log-normal ARIMA: ADAM with model="NNN", an ARIMA and distribution="dlnorm": the ARIMA applies to the logarithms, , , , so the scale of the error is proportional to the level. In the comparisons with fixed orders, the orders and constant are those AutoMSARIMA selects on the same series. Source: Svetunkov (2023).
D12 reforecast: reforecast() of smooth: draws the parameters 300 times from a normal distribution with the estimated covariance of the parameters, reapplies the model with each draw and simulates the predictive distribution, so that the quantiles include the uncertainty of the parameters.
D15 ETS forced and selected: ETS of smooth with backcasting: AutoADAM-style selection among ETS models (ES(model="ZXZ"), or ZXN for non-seasonal series), or ETS(ANN) or ETS(MNN) fitted to every series. Source: Svetunkov (2023).
D16 other ARIMA implementations: statsforecast AutoARIMA, pmdarima auto_arima and skforecast Arima, as run in the notebook of the smooth benchmark of 2026-11-05, whose saved forecasts were read.
Data 7
D2 known-model simulation: Gaussian ARIMA series with generated from 11 data generating processes (white noise with a constant, random walk with and without drift, AR(1), MA(1), ARIMA(0,1,1), ARIMA(1,1,0), ARIMA(1,1,1), ARIMA(0,2,2), seasonal SARIMA(0,1,1)(0,1,1) and SARIMA(1,0,0)(1,0,0)) plus an IMA(1,1) with Student-t errors on 4 degrees of freedom; in-sample lengths of 15, 25, 50, 100 and 300, holdout of 18; 2,000 replicates per process and length with seed 20261105 unless stated.
D5 benchmark: The 5,315 series of M1 (1,001), M3 (3,003) and Tourism (1,311) from fcompdata 0.1.4, with their own holdouts and seasonal periods; lags for seasonal series. Members: D18, D19, D20.
D6 M4 sample: 1,500 series each of the yearly, quarterly and monthly M4 series, drawn with seed 20261105 without replacement, with the M4 holdouts. Source: Makridakis et al. (2020).
D9 fresh M4 sample: 1,500 series each of the yearly, quarterly and monthly M4 series, drawn with seed 20261107 from the series not in the M4 sample, so disjoint from it. Source: Makridakis et al. (2020).
D18 M1: The 1,001 series of the M1 competition with their holdouts. Source: Makridakis et al. (1982).
D19 M3: The 3,003 series of the M3 competition with their holdouts. Source: Makridakis and Hibon (2000).
D20 Tourism: The 1,311 series of the tourism forecasting competition with their holdouts. Source: Athanasopoulos et al. (2011).
Variables and measures 4
D4 coverage: For a quantile , the share of holdout observations at or below it, , averaged first within a series and then over series. cov80 is , the coverage of the central 80% interval; q50 is .
D13 MCE: Mean calibration error over the 99 quantile levels : , with the coverage of .
D14 scaled pinball: Pinball loss averaged over the 99 quantile levels and the horizons, divided by the mean absolute first difference of the in-sample data for real series; in the simulation, by , and relpin is its ratio to the pinball of the true predictive distribution.
D17 level ratio: Mean of the last third of the in-sample data of a series divided by the mean of all its in-sample data.
Study design 2
D3 cases T, E, S, W: What the fitted AutoMSARIMA or MSARIMA knows about the data generating process of the known-model simulation: T, true orders and true AR, MA and constant parameters with initial states and scale estimated; E, true orders with estimated parameters; S, orders selected by AutoMSARIMA; W, a fixed wrong model for each process. Each with backcasting or optimal initial states.
D7 level terciles: Series split into terciles of the level ratio across the series of a data set; cov80 reported for each tercile, and the spread as the largest minus the smallest of the three.
Settings 1
D21 smooth 1.0.8 and 1.3.0: Python smooth at tag v1.0.8-py (a separate worktree with its own environment) and at 1.3.0 (commit 634657d8 of openforecast-org/smooth).
Assumptions
The coverage of a set of series is well summarised by first averaging the holdout observations within each series and then averaging over series, all horizons together. Rested on by C1.
Principal claims
With the true orders and true parameters, the MSARIMA analytic interval is calibrated over the 99 quantiles in the known-model simulation at of 100 and 300: MCE lies between 0.0007 and 0.0024 and the ratio of the interval width to the theoretical width between 0.9965 and 1.0019, with backcasting and with optimal initial states.
Scope: data: simulated Gaussian ARIMA and SARIMA series; conditions: holdout of 18, smooth 1.3.0 (Python), case T of the cases T, E, S, W, T of 100 and 300 · Simulation: E1 (R89, R63, R59, R46), artefacts A3, A8 · Uses: C7, C12 · Assumes: C24 · Addresses: Svetunkov (2023) · Planned: lab plan PL4, planned 5 November 2026 · Outcome: computed from the recorded results
On the M4 sample, the 80% coverage of AutoMSARIMA falls with the level ratio: 0.813, 0.700 and 0.554 from the lowest to the highest of the level terciles, while ETS(MNN) of ETS forced and selected, whose error scale follows the level, covers 0.764, 0.778 and 0.814.
Scope: data: M4 yearly, quarterly and monthly series; conditions: backcasting, smooth 1.3.0 (Python) · Data: E8 (R7, R8, R9, R18, R19, R20) · Uses: C8 · Assumes: C25 · Limitations: L2, L3 · Addresses: Chatfield (1993) · Planned: lab plan PL12, planned 5 November 2026 · Outcome: computed from the recorded results · Weaknesses: the code changed after the plan
On the M4 sample, the log-normal ARIMA with the orders AutoMSARIMA selects removes the fall of 80% coverage over the level terciles (0.774, 0.783 and 0.752, a spread of 0.031) and lowers MCE from 0.0386 to 0.0177.
Scope: data: M4 yearly, quarterly and monthly series; conditions: backcasting, orders fixed at those AutoMSARIMA selects · Data: E9 (R18, R19, R20, R22, R3, R14) · Uses: C2 · Limitations: L2 · Planned: lab plan PL13, planned 5 November 2026 · Outcome: computed from the recorded results · Weaknesses: the code changed after the plan
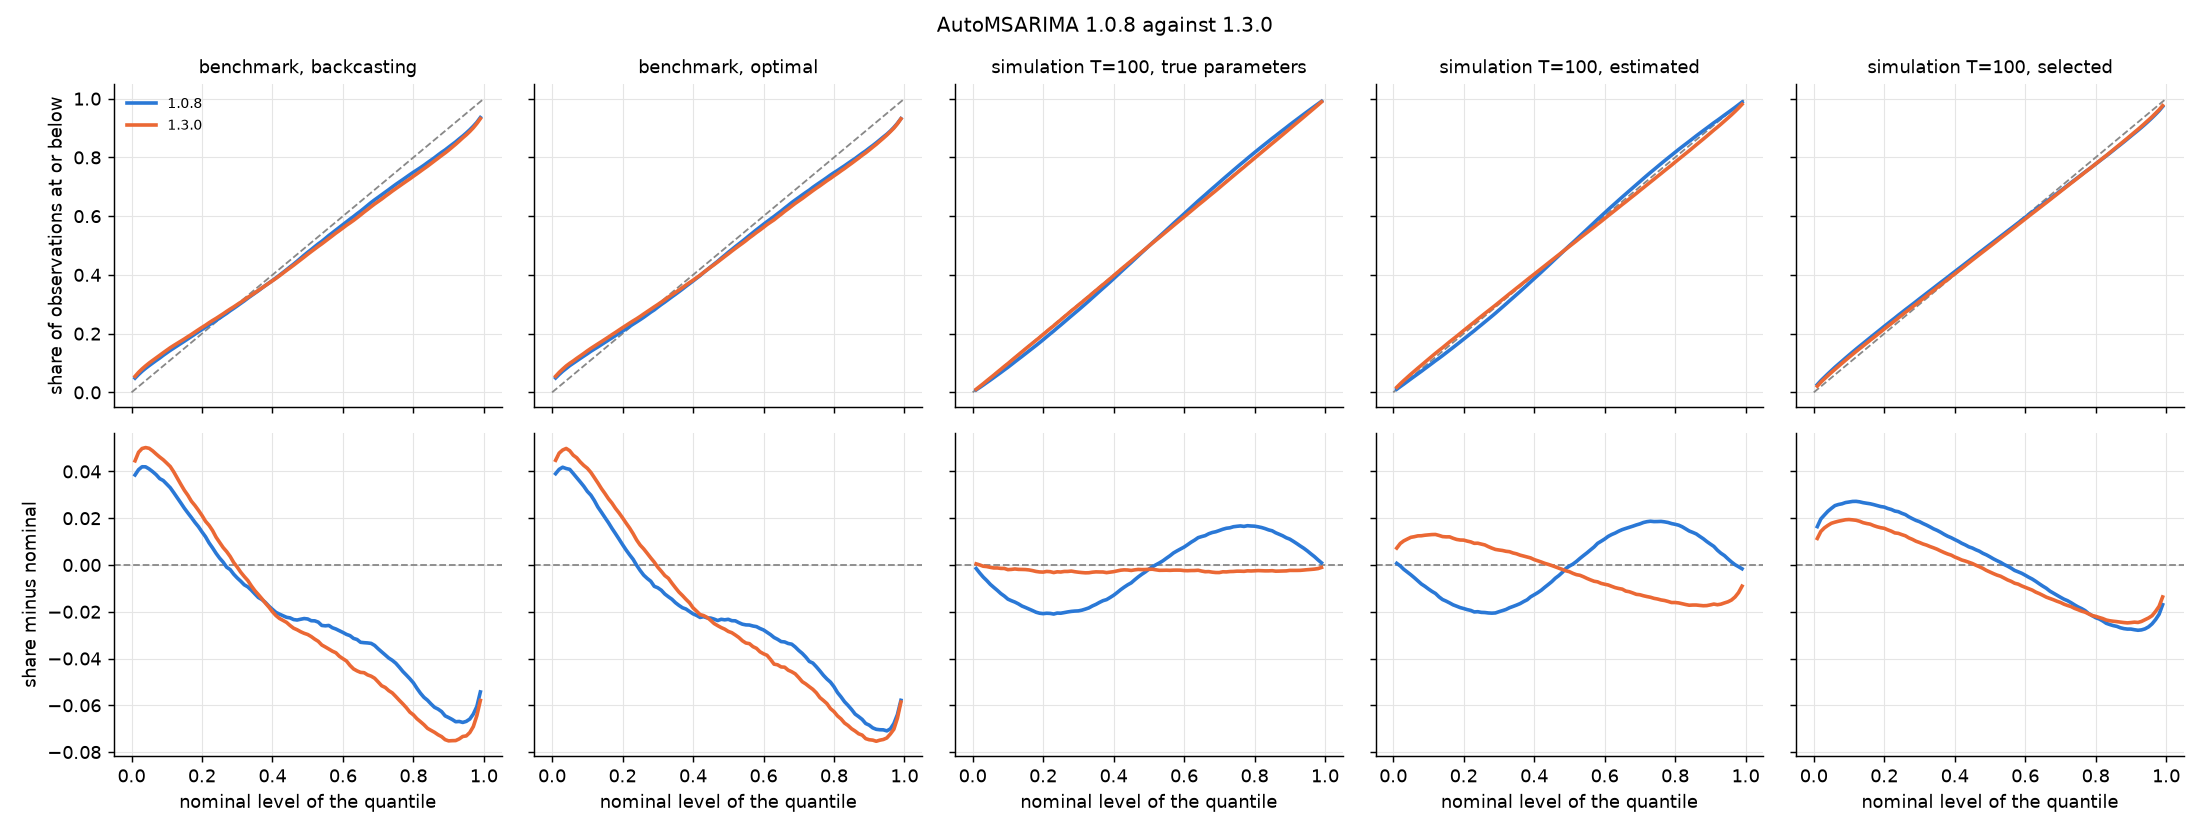
On known models, the AutoMSARIMA interval of smooth 1.3.0 is calibrated no worse than that of 1.0.8 (smooth 1.0.8 and 1.3.0): at in the known-model simulation its MCE is 0.0100 against 0.0120 with estimated parameters, 0.0139 against 0.0172 with selected orders and 0.0085 against 0.0246 with optimal initial states.
Scope: data: simulated Gaussian ARIMA and SARIMA series; conditions: holdout of 18, T = 100, cases E and S · Simulation: E10 (R76, R441, R102, R467, R89, R454), artefacts A4, A8 · Uses: C9 · Limitations: L2, L4 · Planned: lab plan PL11, planned 5 November 2026 · Outcome: computed from the recorded results · Weaknesses: the code changed after the plan
On the fresh M4 sample, auto.adam error selection lowers MCE from 0.0352 to 0.0224 and the spread of 80% coverage over the level terciles from 0.272 to 0.077 against R auto.msarima (AutoMSARIMA), short of the planned reduction of MCE to 0.6 times that of auto.msarima, so the planned test is inconclusive.
Scope: data: M4 yearly, quarterly and monthly series; conditions: backcasting, R smooth 4.6 · Data: E12 (R7, R25, R13, R31), artefacts A6 · Limitations: L5, L6 · Planned: lab plan PL15, planned 9 November 2026 · Outcome: computed from the recorded results
The wider intervals of ETS than of AutoMSARIMA on the benchmark come from the multiplicative-error models in the ETS pool of ETS forced and selected, not from how either package computes the interval.
Scope: data: M1, M3 and Tourism series; conditions: backcasting · Argument: W1 · Uses: C10, C11
Supporting claims
With estimated parameters in the known-model simulation, the MSARIMA analytic interval and the simulated interval of the same fit have the same width and MCE at of 50, 100 and 300 (widths 0.957 and 0.957, 0.981 and 0.980, 0.997 and 0.996; MCE 0.0196 and 0.0197, 0.0100 and 0.0100, 0.0026 and 0.0027).
Scope: data: simulated Gaussian ARIMA and SARIMA series; conditions: holdout of 18, smooth 1.3.0 (Python), case E, backcasting · Simulation: E3 (R7, R20, R11, R24, R46, R59, R50, R63, R85, R98, R89, R102), artefacts A8 · Addresses: Svetunkov (2023) · Planned: lab plan PL6, planned 5 November 2026 · Outcome: computed from the recorded results · Used by: C1
On the 5,315 benchmark series, the fall of 80% coverage over the level terciles is shared by AutoMSARIMA (0.786, 0.668, 0.590) and the other ARIMA implementations: statsforecast AutoARIMA (0.789, 0.667, 0.589), pmdarima (0.770, 0.635, 0.582) and skforecast (0.781, 0.658, 0.585).
Scope: data: M1, M3 and Tourism series; conditions: backcasting for smooth · Data: E13 (R1, R2, R3, R4, R5, R6, R7, R8, R9, R10, R11, R12) · Assumes: C25 · Used by: C2
The width of the AutoMSARIMA interval on the benchmark did not change between smooth 1.0.8 and 1.3.0: the median ratio of the 80% widths of 1.3.0 over 1.0.8 is 1.000 with backcasting and with optimal initial states.
Scope: data: M1, M3 and Tourism series · Data: E17 (R1, R2) · Used by: C4
On the 114 benchmark series where the selected ETS(ANN) of ETS forced and selected and the ARIMA(0,1,1) selected by AutoMSARIMA give the same forecast and width, the two have the same 80% coverage, 0.734.
Scope: data: M1, M3 and Tourism series; conditions: backcasting · Data: E13 (R13, R14, R15) · Limitations: L7 · Used by: C6
Forced on all 5,315 benchmark series, ETS(MNN) of ETS forced and selected has an 80% coverage of 0.764, against 0.668 for ETS(ANN) and 0.695 for ARIMA(0,1,1).
Scope: data: M1, M3 and Tourism series; conditions: backcasting · Data: E14 (R3, R2, R1) · Used by: C6
R and Python give the same AutoMSARIMA interval on 500 benchmark series: the median ratio of the 80% widths is 1.000, the same model is selected on every series and both have an 80% coverage of 0.677.
Scope: data: 500 M1, M3 and Tourism series; conditions: backcasting · Data: E18 (R1, R2, R3, R4) · Used by: C1
Whether selecting the orders with AutoMSARIMA loses little coverage in the known-model simulation at was not settled: pooled cov80 with selected orders was 0.756, between the threshold for little loss (0.77) and that for a large loss (0.74).
Scope: data: simulated Gaussian ARIMA and SARIMA series; conditions: holdout of 18, smooth 1.3.0 (Python), case S, T = 100, backcasting · Simulation: E2 (R41), artefacts A8 · Extends: Chatfield (1993) · Planned: lab plan PL5, planned 5 November 2026 · Outcome: computed from the recorded results
Estimating the parameters does not cost 6 points of 80% coverage of the MSARIMA analytic interval at in the known-model simulation: with the true orders, pooled cov80 is 0.800 with true parameters and 0.770 with estimated parameters, a loss of 3 points.
Scope: data: simulated Gaussian ARIMA and SARIMA series; conditions: holdout of 18, smooth 1.3.0 (Python), cases T and E, T = 100, backcasting · Simulation: E4 (R93, R67), artefacts A8 · Extends: Chatfield (1993) · Planned: lab plan PL7, planned 5 November 2026 · Outcome: computed from the recorded results
reforecast does not improve on the MSARIMA analytic interval of predict() in the known-model simulation at with estimated parameters: with backcasting its MCE is 0.0265 against 0.0100 and its relative scaled pinball 1.958 against 1.043; with optimal initial states its MCE is lower (0.0053 against 0.0085) but its relative pinball higher (1.396 against 1.058).
Scope: data: simulated Gaussian ARIMA and SARIMA series; conditions: holdout of 18, smooth 1.3.0 (Python), case E, T = 100 · Simulation: E5 (R76, R89, R78, R91, R102, R115, R104, R117), artefacts A8 · Addresses: Svetunkov (2023) · Planned: lab plan PL8, planned 5 November 2026 · Outcome: computed from the recorded results
A fixed wrong model alone produces under-coverage of the size seen on the benchmark: over 12 wrong models in the known-model simulation at the pooled 80% coverage of the MSARIMA analytic interval is 0.676 and its q50 0.428.
Scope: data: simulated Gaussian ARIMA and SARIMA series; conditions: holdout of 18, smooth 1.3.0 (Python), case W with 12 fixed wrong models, T = 100, backcasting · Simulation: E6 (R41, R44), artefacts A8 · Limitations: L1 · Planned: lab plan PL9, planned 5 November 2026 · Outcome: computed from the recorded results
On the 5,315 benchmark series, reforecast does not close the gap of the 80% coverage of AutoMSARIMA: cov80 moves from 0.681 to 0.683 and its mean scaled pinball is 7e191 against 0.899.
Scope: data: M1, M3 and Tourism series; conditions: backcasting, smooth 1.3.0 (Python) · Data: E7 (R1, R8, R7, R14) · Planned: lab plan PL10, planned 5 November 2026 · Outcome: computed from the recorded results
The planned test of auto.adam error selection against auto.msarima on the fresh M4 sample under plan PL14 gave no result: its only run stopped on loading the M4 data, before any model was fitted.
Scope: data: M4 yearly, quarterly and monthly series · Data: E11 · Planned: lab plan PL14, planned 7 November 2026 · Outcome: computed from the recorded results
On the 5,315 benchmark series, the log-normal ARIMA with the selected orders raises the 80% coverage of AutoMSARIMA from 0.681 to 0.756 and lowers MCE from 0.0402 to 0.0124, but raises the median scaled pinball from 0.496 to 0.551.
Scope: data: M1, M3 and Tourism series; conditions: backcasting, orders fixed at those AutoMSARIMA selects · Data: E15 (R1, R7, R2, R8, R3, R9)
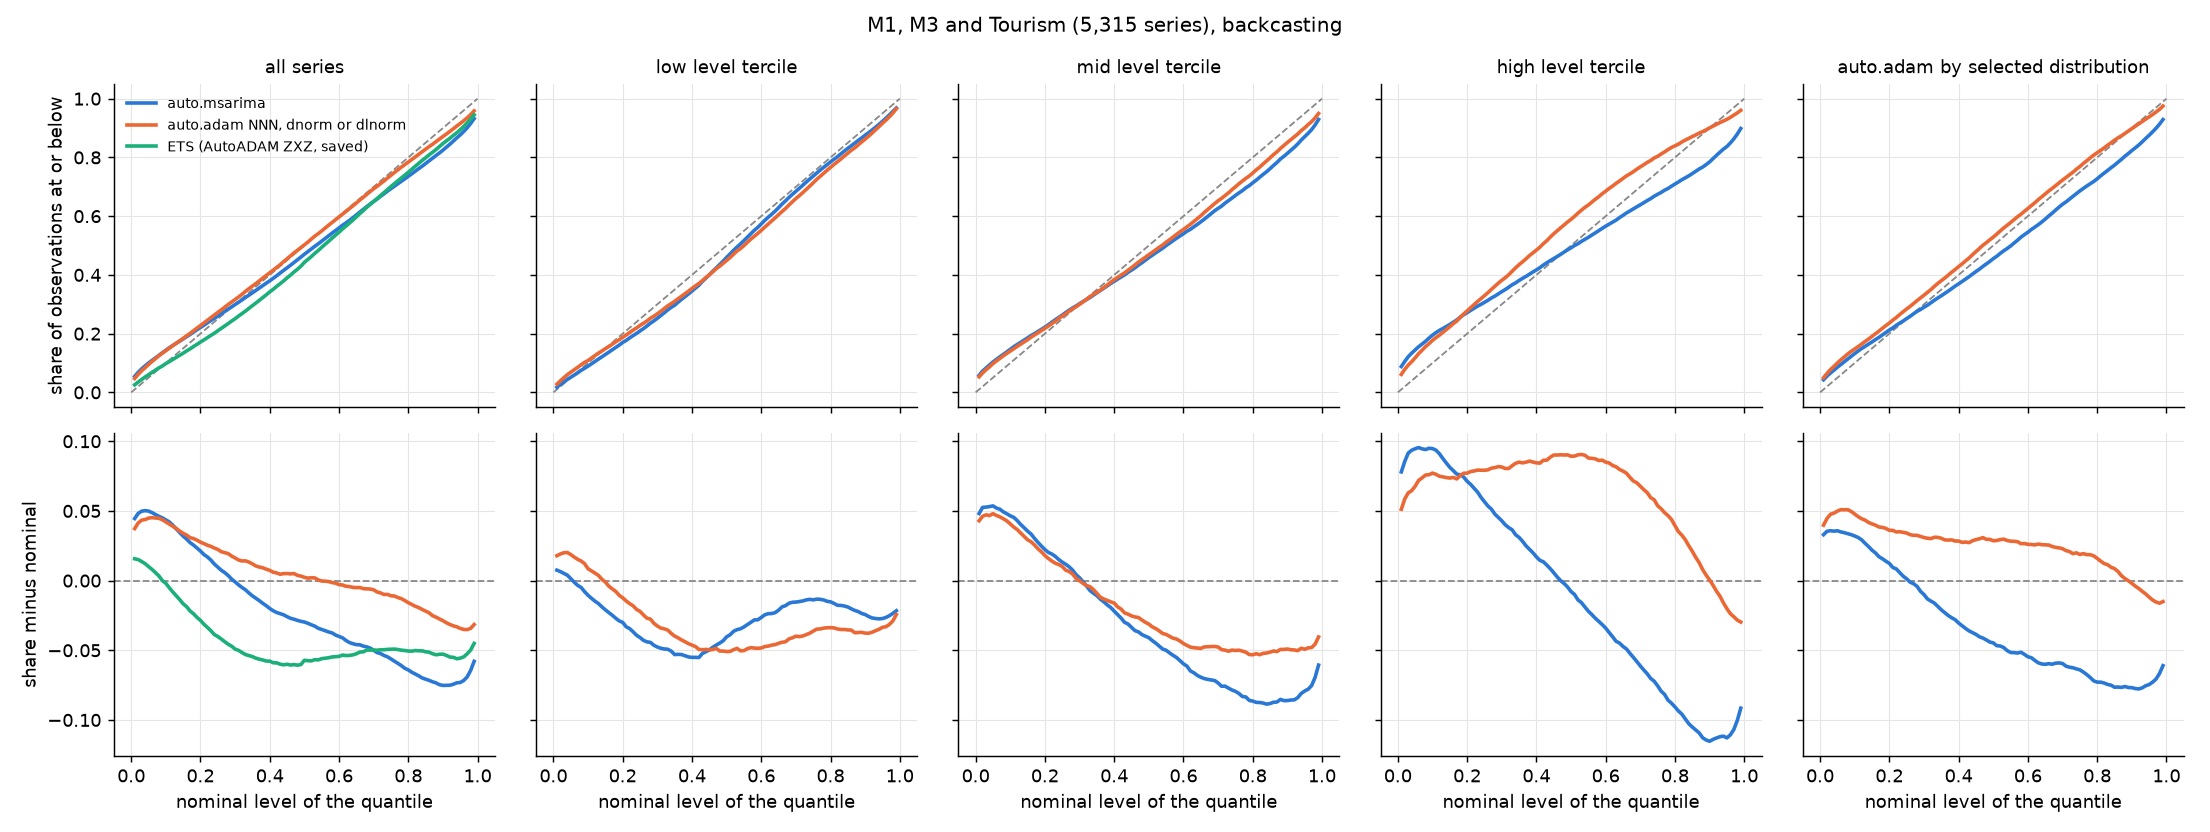
On the 5,315 benchmark series, auto.adam error selection chooses dlnorm for 64% of the series, raises 80% coverage from 0.681 to 0.729, lowers MCE from 0.0402 to 0.0187 and raises the median scaled pinball from 0.496 to 0.514 against R auto.msarima (AutoMSARIMA).
Scope: data: M1, M3 and Tourism series; conditions: backcasting, R smooth 4.6 · Data: E16 (R14, R21, R3, R25, R7, R27, R9), artefacts A5 · Limitations: L5, L6
Estimation and selection alone, as measured in the known-model simulation, predict an 80% coverage of 0.717 for AutoMSARIMA at the lengths of the benchmark series, against 0.801 with the true parameters.
Scope: data: simulated series at the lengths of the M1, M3 and Tourism series; conditions: backcasting, case S · Data: E19 (R3, R1) · Limitations: L8 · Extends: Chatfield (1993)
On the fresh M4 sample, auto.adam error selection has a higher MCE than R auto.msarima (AutoMSARIMA) in the lowest and highest level terciles (0.041 against 0.035, and 0.105 against 0.076) and a lower one only in the middle tercile (0.020 against 0.041), so its lower overall MCE comes in part from errors of opposite sign in different series.
Scope: data: M4 yearly, quarterly and monthly series; conditions: backcasting, R smooth 4.6 · Data: E20 (R39, R40, R41, R42, R43, R44), artefacts A6
On the 5,315 benchmark series, the MCE of AutoMSARIMA is 0.0402 with smooth 1.3.0 against 0.0326 with 1.0.8 (smooth 1.0.8 and 1.3.0) with backcasting.
Scope: data: M1, M3 and Tourism series; conditions: backcasting · Data: E20 (R16, R17), artefacts A4
Evidence
Simulation of the known-model simulation: in each replicate the model is fitted to the first T observations and its 99 quantiles (0.01 to 0.99) are scored on the 18 holdout observations; results are pooled over the 11 Gaussian processes (mean over the processes of the mean over replicates). Case T of cases T, E, S, W with backcasting and optimal initial states (lab run RN6, plan PL4). Width is the ratio of the 80% interval width to the theoretical -step width; maxcellmce is the largest MCE over the processes.
Setup: studied MSARIMA analytic interval · cases known-model simulation · procedure cases T, E, S, W · lens coverage, MCE
- R41 pooled cov80 over the DGPs = 0.7997 (T: 100, case: T_backcasting)
- R46 pooled width over the DGPs = 1.0019 (T: 100, case: T_backcasting)
- R50 pooled mce over the DGPs = 0.0023 (T: 100, case: T_backcasting)
- R51 pooled maxcellmce over the DGPs = 0.0145 (T: 100, case: T_backcasting)
- R54 pooled cov80 over the DGPs = 0.7972 (T: 100, case: T_optimal)
- R59 pooled width over the DGPs = 0.9965 (T: 100, case: T_optimal)
- R63 pooled mce over the DGPs = 0.0024 (T: 100, case: T_optimal)
- R64 pooled maxcellmce over the DGPs = 0.0145 (T: 100, case: T_optimal)
- R85 pooled width over the DGPs = 1.0007 (T: 300, case: T_backcasting)
- R89 pooled mce over the DGPs = 0.0007 (T: 300, case: T_backcasting)
- R90 pooled maxcellmce over the DGPs = 0.0059 (T: 300, case: T_backcasting)
- R98 pooled width over the DGPs = 0.9992 (T: 300, case: T_optimal)
- R102 pooled mce over the DGPs = 0.0009 (T: 300, case: T_optimal)
- R103 pooled maxcellmce over the DGPs = 0.0059 (T: 300, case: T_optimal)
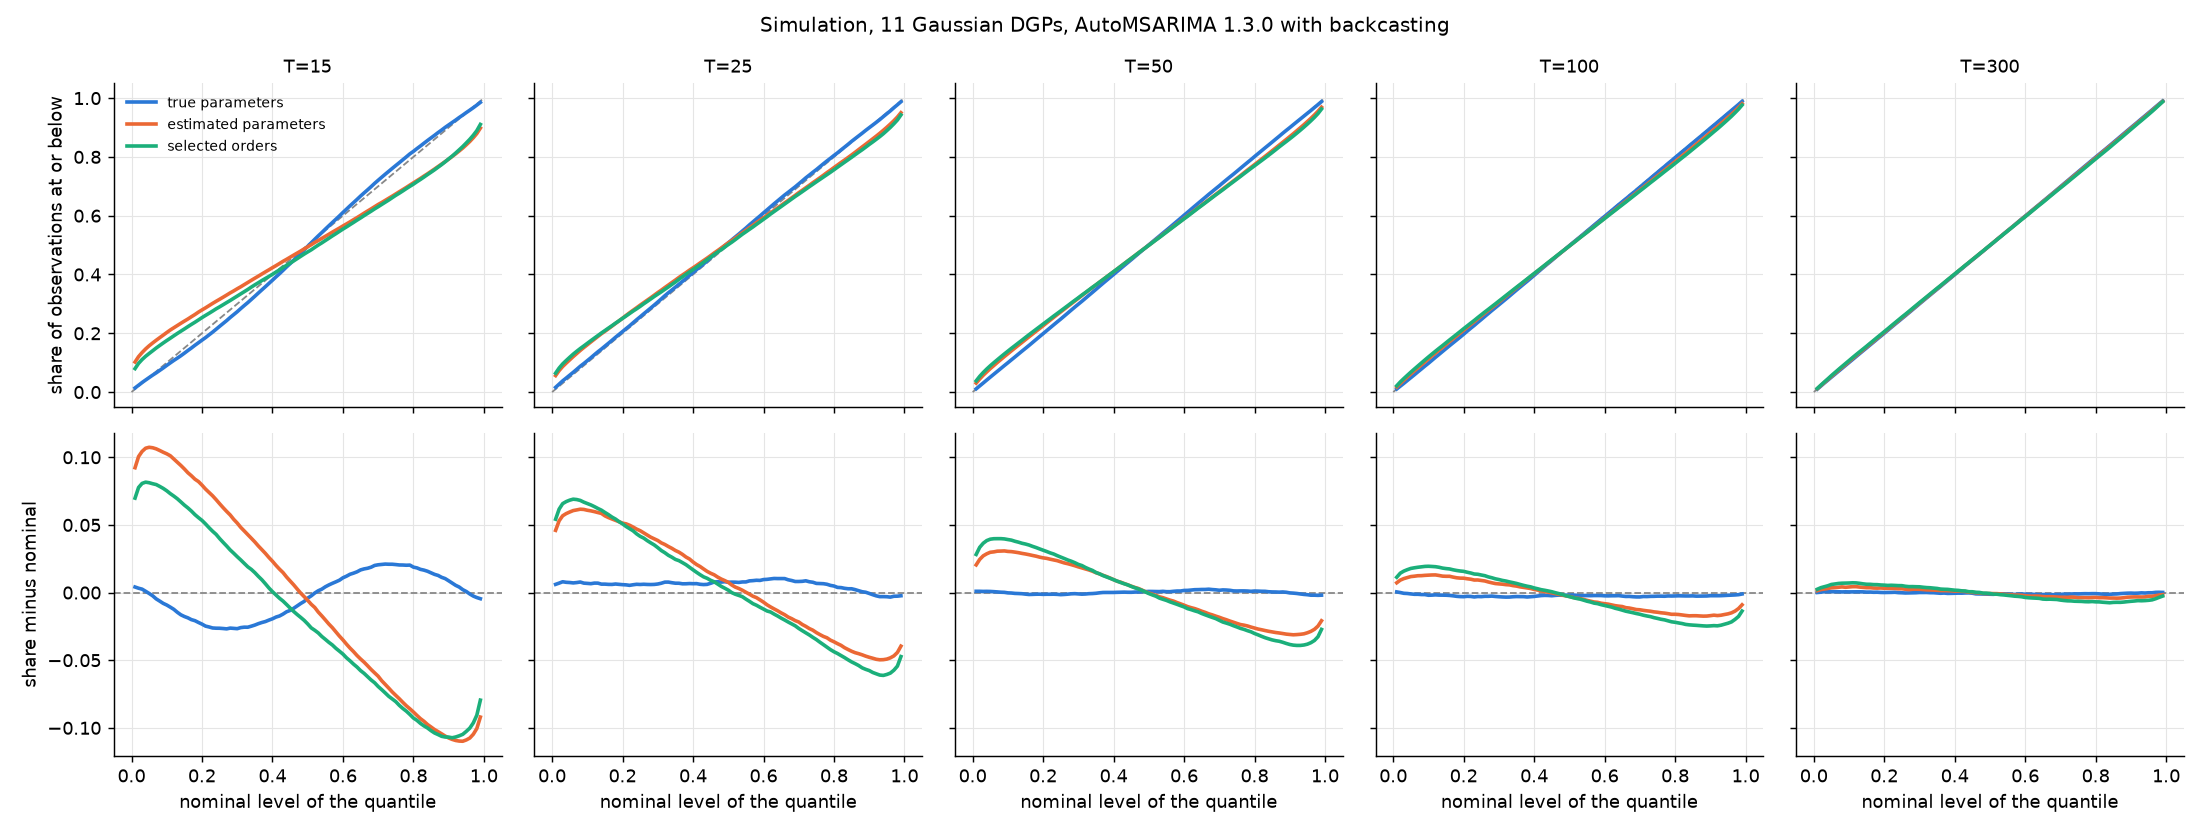
Simulation of the known-model simulation: in each replicate the model is fitted to the first T observations and its 99 quantiles (0.01 to 0.99) are scored on the 18 holdout observations; results are pooled over the 11 Gaussian processes (mean over the processes of the mean over replicates). Case S, orders selected by AutoMSARIMA (run RN11, plan PL5).
Setup: studied AutoMSARIMA · cases known-model simulation · procedure cases T, E, S, W · lens coverage
- R41 pooled cov80 over the DGPs = 0.7559 (T: 100, case: S_backcasting)
- R54 pooled cov80 over the DGPs = 0.7572 (T: 100, case: S_optimal)
Simulation of the known-model simulation: in each replicate the model is fitted to the first T observations and its 99 quantiles (0.01 to 0.99) are scored on the 18 holdout observations; results are pooled over the 11 Gaussian processes (mean over the processes of the mean over replicates). Case E with the MSARIMA analytic interval against the simulated interval of the same fit (interval="simulated", 10,000 paths) (run RN7, plan PL6).
Setup: studied MSARIMA analytic interval · cases known-model simulation · procedure cases T, E, S, W · lens coverage, MCE
- R7 pooled width over the DGPs = 0.9572 (T: 50, case: E_backcasting)
- R11 pooled mce over the DGPs = 0.0196 (T: 50, case: E_backcasting)
- R20 pooled width over the DGPs = 0.957 (T: 50, case: E_backcasting_sim)
- R24 pooled mce over the DGPs = 0.0197 (T: 50, case: E_backcasting_sim)
- R46 pooled width over the DGPs = 0.9807 (T: 100, case: E_backcasting)
- R50 pooled mce over the DGPs = 0.01 (T: 100, case: E_backcasting)
- R59 pooled width over the DGPs = 0.9805 (T: 100, case: E_backcasting_sim)
- R63 pooled mce over the DGPs = 0.01 (T: 100, case: E_backcasting_sim)
- R85 pooled width over the DGPs = 0.9966 (T: 300, case: E_backcasting)
- R89 pooled mce over the DGPs = 0.0026 (T: 300, case: E_backcasting)
- R98 pooled width over the DGPs = 0.9964 (T: 300, case: E_backcasting_sim)
- R102 pooled mce over the DGPs = 0.0027 (T: 300, case: E_backcasting_sim)
Simulation of the known-model simulation: in each replicate the model is fitted to the first T observations and its 99 quantiles (0.01 to 0.99) are scored on the 18 holdout observations; results are pooled over the 11 Gaussian processes (mean over the processes of the mean over replicates). Cases T and E (run RN8, plan PL7).
Setup: studied MSARIMA analytic interval · cases known-model simulation · procedure cases T, E, S, W · lens coverage
- R67 pooled cov80 over the DGPs = 0.7701 (T: 100, case: E_backcasting)
- R93 pooled cov80 over the DGPs = 0.7997 (T: 100, case: T_backcasting)
Simulation of the known-model simulation: in each replicate the model is fitted to the first T observations and its 99 quantiles (0.01 to 0.99) are scored on the 18 holdout observations; results are pooled over the 11 Gaussian processes (mean over the processes of the mean over replicates). Case E with predict() against reforecast (suffix _ref) (run RN9, plan PL8).
Setup: studied MSARIMA analytic interval, reforecast · cases known-model simulation · procedure cases T, E, S, W · lens MCE, scaled pinball
- R76 pooled mce over the DGPs = 0.01 (T: 100, case: E_backcasting)
- R78 pooled relpin over the DGPs = 1.0432 (T: 100, case: E_backcasting)
- R89 pooled mce over the DGPs = 0.0265 (T: 100, case: E_backcasting_ref)
- R91 pooled relpin over the DGPs = 1.9575 (T: 100, case: E_backcasting_ref)
- R102 pooled mce over the DGPs = 0.0085 (T: 100, case: E_optimal)
- R104 pooled relpin over the DGPs = 1.0578 (T: 100, case: E_optimal)
- R115 pooled mce over the DGPs = 0.0053 (T: 100, case: E_optimal_ref)
- R117 pooled relpin over the DGPs = 1.3961 (T: 100, case: E_optimal_ref)
Simulation of the known-model simulation: in each replicate the model is fitted to the first T observations and its 99 quantiles (0.01 to 0.99) are scored on the 18 holdout observations; results are pooled over the 11 Gaussian processes (mean over the processes of the mean over replicates). Case W: each process fitted with one fixed wrong model (e.g. a random walk with drift fitted as ARIMA(0,1,0) without drift, an ARIMA(1,1,1) as ARIMA(0,1,1)); 12 wrong models chosen by the authors (run RN10, plan PL9).
Setup: studied MSARIMA analytic interval · cases known-model simulation · procedure cases T, E, S, W · lens coverage
- R41 pooled cov80 over the DGPs = 0.6756 (T: 100, case: W_backcasting)
- R44 pooled q50 over the DGPs = 0.4281 (T: 100, case: W_backcasting)
- R67 pooled cov80 over the DGPs = 0.8031 (T: 100, case: oracle)
- R70 pooled q50 over the DGPs = 0.4988 (T: 100, case: oracle)
AutoMSARIMA with backcasting fitted to each of the 5,315 benchmark series; predict() and reforecast quantiles scored on the holdout, with the harness of the smooth benchmark notebook of 2026-11-05; the predict() coverage reproduces the saved benchmark array exactly (run RN12, plan PL10).
Setup: studied AutoMSARIMA, reforecast · cases benchmark · lens coverage, scaled pinball
- R1 benchmark cov80 = 0.6812 (initial: backcasting, method: predict)
- R7 benchmark pinball = 0.8991 (initial: backcasting, method: predict)
- R8 benchmark cov80 = 0.6827 (initial: backcasting, method: reforecast)
- R14 benchmark pinball = 6.983616214609794e+191 (initial: backcasting, method: reforecast)
AutoMSARIMA with backcasting and ETS(MNN) fitted to every series of the M4 sample; cov80 per level terciles (run RN41, plan PL12).
Setup: studied AutoMSARIMA, ETS forced and selected · cases M4 sample · procedure level terciles · lens coverage, MCE, level ratio
- R1 M4 cov80 = 0.6889 (method: auto)
- R3 M4 mce = 0.0386 (method: auto)
- R7 M4 cov80_low = 0.8128 (method: auto)
- R8 M4 cov80_mid = 0.6995 (method: auto)
- R9 M4 cov80_high = 0.5544 (method: auto)
- R10 M4 fall_low_to_high = 0.2585 (method: auto)
- R12 M4 cov80 = 0.7854 (method: force_mnn)
- R13 M4 q50 = 0.3723 (method: force_mnn)
- R14 M4 mce = 0.0849 (method: force_mnn)
- R18 M4 cov80_low = 0.764 (method: force_mnn)
- R19 M4 cov80_mid = 0.7779 (method: force_mnn)
- R20 M4 cov80_high = 0.8142 (method: force_mnn)
- R21 M4 fall_low_to_high = -0.0502 (method: force_mnn)
AutoMSARIMA and the log-normal ARIMA with the same selected orders on the M4 sample; MCE and cov80 per level terciles (run RN42, plan PL13).
Setup: studied AutoMSARIMA, log-normal ARIMA · cases M4 sample · procedure level terciles · lens coverage, MCE, scaled pinball, level ratio
- R3 M4 mce = 0.0386 (method: auto)
- R4 M4 pinball_median = 0.6752 (method: auto)
- R11 M4 spread = 0.2585 (method: auto)
- R12 M4 cov80 = 0.7698 (method: auto_dlnorm)
- R14 M4 mce = 0.0177 (method: auto_dlnorm)
- R15 M4 pinball_median = 0.7679 (method: auto_dlnorm)
- R18 M4 cov80_low = 0.7742 (method: auto_dlnorm)
- R19 M4 cov80_mid = 0.7832 (method: auto_dlnorm)
- R20 M4 cov80_high = 0.7521 (method: auto_dlnorm)
- R22 M4 spread = 0.0311 (method: auto_dlnorm)
Simulation of the known-model simulation: in each replicate the model is fitted to the first T observations and its 99 quantiles (0.01 to 0.99) are scored on the 18 holdout observations; results are pooled over the 11 Gaussian processes (mean over the processes of the mean over replicates). Cases T, E, S with backcasting and E with optimal initial states, run with smooth 1.0.8 and 1.3.0 on the same seeds (runs RN43 for 1.0.8 and RN44 for 1.3.0, plan PL11).
Setup: studied AutoMSARIMA · cases known-model simulation · procedure cases T, E, S, W · lens coverage, MCE · context smooth 1.0.8 and 1.3.0
- R76 pooled mce over the DGPs = 0.012 (T: 100, case: E_backcasting, smooth version: 1.0.8)
- R85 pooled width over the DGPs = 3.3857 (T: 100, case: E_optimal, smooth version: 1.0.8)
- R89 pooled mce over the DGPs = 0.0246 (T: 100, case: E_optimal, smooth version: 1.0.8)
- R102 pooled mce over the DGPs = 0.0172 (T: 100, case: S_backcasting, smooth version: 1.0.8)
- R106 pooled cov80 over the DGPs = 0.8256 (T: 100, case: T_backcasting, smooth version: 1.0.8)
- R111 pooled width over the DGPs = 1.1105 (T: 100, case: T_backcasting, smooth version: 1.0.8)
- R441 pooled mce over the DGPs = 0.01 (T: 100, case: E_backcasting, smooth version: 1.3.0)
- R450 pooled width over the DGPs = 1.0111 (T: 100, case: E_optimal, smooth version: 1.3.0)
- R454 pooled mce over the DGPs = 0.0085 (T: 100, case: E_optimal, smooth version: 1.3.0)
- R467 pooled mce over the DGPs = 0.0139 (T: 100, case: S_backcasting, smooth version: 1.3.0)
- R471 pooled cov80 over the DGPs = 0.7997 (T: 100, case: T_backcasting, smooth version: 1.3.0)
- R476 pooled width over the DGPs = 1.0019 (T: 100, case: T_backcasting, smooth version: 1.3.0)
Planned comparison of auto.adam error selection with auto.msarima on the fresh M4 sample (plan PL14). Its only run, RN47, failed while loading M4 because the cached M4 files had been removed; no model was fitted and no result exists.
Setup: studied auto.adam error selection, AutoMSARIMA · cases fresh M4 sample · procedure level terciles · lens MCE
R auto.msarima (AutoMSARIMA) and auto.adam error selection fitted to the 4,500 series of the fresh M4 sample with backcasting; 99 quantiles per series scored on the M4 holdouts; MCE, cov80 by level terciles, scaled pinball, and the share of series choosing dlnorm (run RN48, plan PL15, which repeats PL14 after its failed run).
Setup: studied auto.adam error selection, AutoMSARIMA · cases fresh M4 sample · procedure level terciles · lens coverage, MCE, scaled pinball, level ratio
- R3 m4 cov80 = 0.7461 (method: adam_select)
- R7 m4 mce = 0.0224 (method: adam_select)
- R9 m4 pinball_median = 0.7514 (method: adam_select)
- R10 m4 cov80_low = 0.7865 (method: adam_select)
- R11 m4 cov80_mid = 0.7425 (method: adam_select)
- R12 m4 cov80_high = 0.7092 (method: adam_select)
- R13 m4 spread = 0.0773 (method: adam_select)
- R14 m4 share_dlnorm = 0.6702 (method: adam_select)
- R21 m4 cov80 = 0.6923 (method: msarima)
- R25 m4 mce = 0.0352 (method: msarima)
- R27 m4 pinball_median = 0.6872 (method: msarima)
- R28 m4 cov80_low = 0.8193 (method: msarima)
- R29 m4 cov80_mid = 0.7098 (method: msarima)
- R30 m4 cov80_high = 0.5477 (method: msarima)
- R31 m4 spread = 0.2715 (method: msarima)
Coverage by level terciles on the 5,315 benchmark series for AutoMSARIMA with backcasting (refitted) and for the other ARIMA implementations (saved forecasts of the smooth benchmark of 2026-11-05); and coverage of ETS and ARIMA on the series where the selected ETS(ANN) of ETS forced and selected and the selected ARIMA(0,1,1) give the same forecast and width (exploratory run RN15).
Setup: studied AutoMSARIMA, other ARIMA implementations, ETS forced and selected · cases benchmark · procedure level terciles · lens coverage, level ratio
- R1 cov80 by tercile = 0.7862 (method: auto_back, by: level_t, tercile: low)
- R2 cov80 by tercile = 0.6677 (method: auto_back, by: level_t, tercile: mid)
- R3 cov80 by tercile = 0.5897 (method: auto_back, by: level_t, tercile: high)
- R4 cov80 by tercile = 0.7891 (method: statsforecast AutoARIMA arima, by: level_t, tercile: low)
- R5 cov80 by tercile = 0.6672 (method: statsforecast AutoARIMA arima, by: level_t, tercile: mid)
- R6 cov80 by tercile = 0.5893 (method: statsforecast AutoARIMA arima, by: level_t, tercile: high)
- R7 cov80 by tercile = 0.7702 (method: pmdarima auto_arima arima, by: level_t, tercile: low)
- R8 cov80 by tercile = 0.6354 (method: pmdarima auto_arima arima, by: level_t, tercile: mid)
- R9 cov80 by tercile = 0.5825 (method: pmdarima auto_arima arima, by: level_t, tercile: high)
- R10 cov80 by tercile = 0.7809 (method: skforecast Arima arima, by: level_t, tercile: low)
- R11 cov80 by tercile = 0.6578 (method: skforecast Arima arima, by: level_t, tercile: mid)
- R12 cov80 by tercile = 0.5854 (method: skforecast Arima arima, by: level_t, tercile: high)
- R13 series with the same forecast and width among ETS(ANN) and ARIMA(0,1,1) selected = 114
- R14 cov80 among ETS(ANN) and ARIMA(0,1,1) selected = 0.7336 (subset: same forecast, method: ETS)
- R15 cov80 among ETS(ANN) and ARIMA(0,1,1) selected = 0.7336 (subset: same forecast, method: ARIMA)
ETS forced and selected and ARIMA(0,1,1) forced on all 5,315 benchmark series and the selected ETS and AutoMSARIMA models, backcasting; cov80 per method (exploratory run RN14 on the forecasts of RN13).
Setup: studied ETS forced and selected, AutoMSARIMA · cases benchmark · lens coverage
- R1 cov80 of the forced model on all series = 0.6951 (method: force_011)
- R2 cov80 of the forced model on all series = 0.6681 (method: force_ann)
- R3 cov80 of the forced model on all series = 0.7635 (method: force_mnn)
- R4 cov80 ETS = 0.7492 (subset: all series)
- R5 cov80 ARIMA = 0.6812 (subset: all series)
AutoMSARIMA and the log-normal ARIMA with the same selected orders on the 5,315 benchmark series, backcasting; cov80, MCE, scaled pinball and cov80 per level terciles (exploratory run RN38).
Setup: studied AutoMSARIMA, log-normal ARIMA · cases benchmark · procedure level terciles · lens coverage, MCE, scaled pinball, level ratio
- R1 cov80 = 0.6812 (data: benchmark, method: auto)
- R2 MCE = 0.0402 (data: benchmark, method: auto)
- R3 pinball_median = 0.4959 (data: benchmark, method: auto)
- R4 cov80_low = 0.7862 (data: benchmark, method: auto)
- R5 cov80_mid = 0.6677 (data: benchmark, method: auto)
- R6 cov80_high = 0.5897 (data: benchmark, method: auto)
- R7 cov80 = 0.7563 (data: benchmark, method: auto_dlnorm)
- R8 MCE = 0.0124 (data: benchmark, method: auto_dlnorm)
- R9 pinball_median = 0.5507 (data: benchmark, method: auto_dlnorm)
- R10 cov80_low = 0.7493 (data: benchmark, method: auto_dlnorm)
- R11 cov80_mid = 0.7514 (data: benchmark, method: auto_dlnorm)
- R12 cov80_high = 0.7683 (data: benchmark, method: auto_dlnorm)
- R13 pinball_mean = 0.8991 (data: benchmark, method: auto)
- R14 pinball_mean = 1.0916 (data: benchmark, method: auto_dlnorm)
R auto.msarima (AutoMSARIMA) and auto.adam error selection on the 5,315 benchmark series, backcasting; 99 quantiles per series; MCE, cov80 by level terciles, scaled pinball and the share choosing dlnorm (exploratory run RN45). Run in R because Python's AutoADAM removes dlnorm from the candidate distributions of a pure ARIMA whatever the user passes.
Setup: studied auto.adam error selection, AutoMSARIMA · cases benchmark · procedure level terciles · lens coverage, MCE, scaled pinball, level ratio
- R1 benchmark n = 5315 (method: adam_select)
- R2 benchmark failed = 0 (method: adam_select)
- R3 benchmark cov80 = 0.7291 (method: adam_select)
- R4 benchmark q10 = 0.1421 (method: adam_select)
- R5 benchmark q50 = 0.5024 (method: adam_select)
- R6 benchmark q90 = 0.8712 (method: adam_select)
- R7 benchmark mce = 0.0187 (method: adam_select)
- R8 benchmark pinball_mean = 0.9225 (method: adam_select)
- R9 benchmark pinball_median = 0.5137 (method: adam_select)
- R10 benchmark cov80_low = 0.7539 (method: adam_select)
- R11 benchmark cov80_mid = 0.7102 (method: adam_select)
- R12 benchmark cov80_high = 0.7233 (method: adam_select)
- R13 benchmark spread = 0.0436 (method: adam_select)
- R14 benchmark share_dlnorm = 0.642 (method: adam_select)
- R15 benchmark cov80_when_dlnorm = 0.7503 (method: adam_select)
- R16 benchmark mce_when_dlnorm = 0.0273 (method: adam_select)
- R17 benchmark cov80_when_dnorm = 0.6912 (method: adam_select)
- R18 benchmark mce_when_dnorm = 0.0443 (method: adam_select)
- R19 benchmark n = 5315 (method: msarima)
- R20 benchmark failed = 0 (method: msarima)
- R21 benchmark cov80 = 0.6812 (method: msarima)
- R22 benchmark q10 = 0.1436 (method: msarima)
- R23 benchmark q50 = 0.4703 (method: msarima)
- R24 benchmark q90 = 0.8248 (method: msarima)
- R25 benchmark mce = 0.0402 (method: msarima)
- R26 benchmark pinball_mean = 0.8991 (method: msarima)
- R27 benchmark pinball_median = 0.4959 (method: msarima)
- R28 benchmark cov80_low = 0.7862 (method: msarima)
- R29 benchmark cov80_mid = 0.6674 (method: msarima)
- R30 benchmark cov80_high = 0.59 (method: msarima)
- R31 benchmark spread = 0.1962 (method: msarima)
- R32 benchmark share_dlnorm = 0 (method: msarima)
- R33 benchmark cov80_when_dnorm = 0.6812 (method: msarima)
- R34 benchmark mce_when_dnorm = 0.0402 (method: msarima)
AutoMSARIMA forecasts of the 5,315 benchmark series with smooth 1.0.8 and 1.3.0 decomposed in stages: A, 1.0.8; D, 1.3.0 with the parameters of A; B, 1.3.0 with the orders of A; C, 1.3.0. Width ratios are medians over series of the 80% interval width of the later stage over the earlier one (exploratory run RN20 on runs RN16 to RN19).
Setup: studied AutoMSARIMA · cases benchmark · lens coverage · context smooth 1.0.8 and 1.3.0
- R1 width_all = 1 (initial: backcasting, stage: A->C)
- R2 width_all = 1 (initial: optimal, stage: A->C)
- R3 width_all = 0.9871 (initial: backcasting, stage: A->D)
- R4 dcov80 = -0.0189 (initial: backcasting, stage: A->C)
- R5 share with drift = 0.2476 (initial: backcasting, stage: C)
- R6 share with drift = 0.3087 (initial: backcasting, stage: A)
500 benchmark series drawn with seed 41: R msarima with the orders Python selected, and R auto.msarima against Python AutoMSARIMA, backcasting; ratio of the 80% interval widths and coverage (exploratory run RN37).
Setup: studied AutoMSARIMA · cases benchmark · lens coverage
- R1 median_width_ratio_R_over_Python = 1 (sample: 500)
- R2 share_same_auto = 1 (sample: 500)
- R3 cov80_R_auto = 0.6766 (sample: 500)
- R4 cov80_Python_auto = 0.6766 (sample: 500)
Coverage the known-model simulation predicts at the lengths of the 5,315 benchmark series: the pooled cov80 of each case of cases T, E, S, W interpolated on log T at each series length (lengths below 15 and above 300 at the nearest size) and averaged over the series (exploratory run RN40 on runs RN8, RN11, RN39).
Setup: studied AutoMSARIMA · cases known-model simulation, benchmark · procedure cases T, E, S, W · lens coverage
- R1 cov80 expected at the benchmark lengths = 0.8012 (case: T_backcasting)
- R2 cov80 expected at the benchmark lengths = 0.725 (case: E_backcasting)
- R3 cov80 expected at the benchmark lengths = 0.7169 (case: S_backcasting)
MCE of each calibration curve of the 99 quantiles drawn from recorded outputs: the known-model simulation (runs RN8, RN11, RN39), smooth 1.0.8 and 1.3.0 (RN16, RN19, RN43, RN44), the benchmark (RN45 and the saved ETS benchmark) and the fresh M4 sample (RN48), overall and by level terciles (exploratory run RN49).
Setup: studied AutoMSARIMA, auto.adam error selection, ETS forced and selected · cases known-model simulation, benchmark, fresh M4 sample · procedure level terciles · lens MCE
- R1 mean absolute calibration error = 0.0144 (figure: calibration_simulation.png, panel: T=15, line: true parameters)
- R2 mean absolute calibration error = 0.0653 (figure: calibration_simulation.png, panel: T=15, line: estimated parameters)
- R3 mean absolute calibration error = 0.0579 (figure: calibration_simulation.png, panel: T=15, line: selected orders)
- R4 mean absolute calibration error = 0.0064 (figure: calibration_simulation.png, panel: T=25, line: true parameters)
- R5 mean absolute calibration error = 0.0341 (figure: calibration_simulation.png, panel: T=25, line: estimated parameters)
- R6 mean absolute calibration error = 0.0366 (figure: calibration_simulation.png, panel: T=25, line: selected orders)
- R7 mean absolute calibration error = 0.001 (figure: calibration_simulation.png, panel: T=50, line: true parameters)
- R8 mean absolute calibration error = 0.0196 (figure: calibration_simulation.png, panel: T=50, line: estimated parameters)
- R9 mean absolute calibration error = 0.0235 (figure: calibration_simulation.png, panel: T=50, line: selected orders)
- R10 mean absolute calibration error = 0.0023 (figure: calibration_simulation.png, panel: T=100, line: true parameters)
- R11 mean absolute calibration error = 0.01 (figure: calibration_simulation.png, panel: T=100, line: estimated parameters)
- R12 mean absolute calibration error = 0.0139 (figure: calibration_simulation.png, panel: T=100, line: selected orders)
- R13 mean absolute calibration error = 0.0007 (figure: calibration_simulation.png, panel: T=300, line: true parameters)
- R14 mean absolute calibration error = 0.0026 (figure: calibration_simulation.png, panel: T=300, line: estimated parameters)
- R15 mean absolute calibration error = 0.0046 (figure: calibration_simulation.png, panel: T=300, line: selected orders)
- R16 mean absolute calibration error = 0.0326 (figure: calibration_versions.png, panel: benchmark, backcasting, line: 1.0.8)
- R17 mean absolute calibration error = 0.0402 (figure: calibration_versions.png, panel: benchmark, backcasting, line: 1.3.0)
- R18 mean absolute calibration error = 0.0331 (figure: calibration_versions.png, panel: benchmark, optimal, line: 1.0.8)
- R19 mean absolute calibration error = 0.039 (figure: calibration_versions.png, panel: benchmark, optimal, line: 1.3.0)
- R20 mean absolute calibration error = 0.0123 (figure: calibration_versions.png, panel: simulation T=100, true parameters, line: 1.0.8)
- R21 mean absolute calibration error = 0.0023 (figure: calibration_versions.png, panel: simulation T=100, true parameters, line: 1.3.0)
- R22 mean absolute calibration error = 0.012 (figure: calibration_versions.png, panel: simulation T=100, estimated, line: 1.0.8)
- R23 mean absolute calibration error = 0.01 (figure: calibration_versions.png, panel: simulation T=100, estimated, line: 1.3.0)
- R24 mean absolute calibration error = 0.0172 (figure: calibration_versions.png, panel: simulation T=100, selected, line: 1.0.8)
- R25 mean absolute calibration error = 0.0139 (figure: calibration_versions.png, panel: simulation T=100, selected, line: 1.3.0)
- R26 mean absolute calibration error = 0.0402 (figure: calibration_benchmark.png, panel: all series, line: auto.msarima)
- R27 mean absolute calibration error = 0.0187 (figure: calibration_benchmark.png, panel: all series, line: auto.adam NNN, dnorm or dlnorm)
- R28 mean absolute calibration error = 0.0442 (figure: calibration_benchmark.png, panel: all series, line: ETS (AutoADAM ZXZ, saved))
- R29 mean absolute calibration error = 0.0281 (figure: calibration_benchmark.png, panel: low level tercile, line: auto.msarima)
- R30 mean absolute calibration error = 0.0334 (figure: calibration_benchmark.png, panel: low level tercile, line: auto.adam NNN, dnorm or dlnorm)
- R31 mean absolute calibration error = 0.0505 (figure: calibration_benchmark.png, panel: mid level tercile, line: auto.msarima)
- R32 mean absolute calibration error = 0.0352 (figure: calibration_benchmark.png, panel: mid level tercile, line: auto.adam NNN, dnorm or dlnorm)
- R33 mean absolute calibration error = 0.0623 (figure: calibration_benchmark.png, panel: high level tercile, line: auto.msarima)
- R34 mean absolute calibration error = 0.0655 (figure: calibration_benchmark.png, panel: high level tercile, line: auto.adam NNN, dnorm or dlnorm)
- R35 mean absolute calibration error = 0.0443 (figure: calibration_benchmark.png, panel: auto.adam by selected distribution, line: chose dnorm)
- R36 mean absolute calibration error = 0.0273 (figure: calibration_benchmark.png, panel: auto.adam by selected distribution, line: chose dlnorm)
- R37 mean absolute calibration error = 0.0352 (figure: calibration_m4.png, panel: all series, line: auto.msarima)
- R38 mean absolute calibration error = 0.0224 (figure: calibration_m4.png, panel: all series, line: auto.adam NNN, dnorm or dlnorm)
- R39 mean absolute calibration error = 0.0348 (figure: calibration_m4.png, panel: low level tercile, line: auto.msarima)
- R40 mean absolute calibration error = 0.041 (figure: calibration_m4.png, panel: low level tercile, line: auto.adam NNN, dnorm or dlnorm)
- R41 mean absolute calibration error = 0.0412 (figure: calibration_m4.png, panel: mid level tercile, line: auto.msarima)
- R42 mean absolute calibration error = 0.02 (figure: calibration_m4.png, panel: mid level tercile, line: auto.adam NNN, dnorm or dlnorm)
- R43 mean absolute calibration error = 0.0757 (figure: calibration_m4.png, panel: high level tercile, line: auto.msarima)
- R44 mean absolute calibration error = 0.1052 (figure: calibration_m4.png, panel: high level tercile, line: auto.adam NNN, dnorm or dlnorm)
- R45 mean absolute calibration error = 0.0209 (figure: calibration_m4.png, panel: auto.adam by selected distribution, line: chose dnorm)
- R46 mean absolute calibration error = 0.0351 (figure: calibration_m4.png, panel: auto.adam by selected distribution, line: chose dlnorm)
Where ETS and ARIMA reduce to the same model, their intervals coincide and cover the same share (C17), so the interval computations agree; the additive ETS(ANN) forced on every series covers no more than ARIMA(0,1,1), while the multiplicative ETS(MNN) covers 0.07 to 0.10 more (C22). The difference between the pools is therefore the multiplicative-error models, which AutoMSARIMA does not have.
Limitations
The 12 wrong models of case W were chosen by the authors, not drawn from the mistakes AutoMSARIMA makes, so the size of the coverage loss they produce depends on that choice.
The lab record flags plans PL11, PL12 and PL13 with code changed after the plan; the only commit between those plans and their runs updated the claimset skills under .claude/skills, not the analysis scripts.
ETS(MNN), the comparator whose coverage stays flat over the level terciles on M4, is badly centred there (q50 of 0.372) and has an MCE of 0.0849, so its flat cov80 does not make it well calibrated.
smooth 1.0.8 ran from a separate worktree at tag v1.0.8-py with its own Python environment, so the versions also differ in the environment around the package.
The auto.adam comparison ran in R, because Python's AutoADAM removes dlnorm from the candidate distributions of a pure ARIMA whatever the user passes, while R's auto.adam removes it only from its default list.
The thresholds of plan PL15 were fixed after the exploratory benchmark run of auto.adam (RN45) was seen, on M4 series that run did not use.
The series where the selected ETS(ANN) and ARIMA(0,1,1) give the same forecast and width are 114 of 5,315.
The prediction of coverage at the benchmark lengths uses Gaussian processes and interpolates the simulated coverage over log length, with lengths outside 15 to 300 at the nearest simulated size.
Open questions
Why do the quantiles of auto.adam with error selection lie too high, by about 0.08 to 0.13 of coverage between the 0.2 and 0.6 quantiles, on the series of the highest level tercile, and would a model of the location of grown series correct it?
Why do the parameter draws of reforecast() give explosive or several times too wide intervals for ARIMA models with a constant or AR terms, differently in R and Python?
Would AutoMSARIMA calibrate better with error selection than with a fixed log-normal error once the location error of grown series is addressed, given that the fixed log-normal error costs 11% of median pinball on the benchmark?
Which of the changes between smooth 1.0.8 and 1.3.0 that alter model selection (fewer drift models chosen with backcasting) makes the benchmark calibration of AutoMSARIMA worse while its calibration on known models improves?
References
- Makridakis et al. (1982) Makridakis, S., Andersen, A., Carbone, R., Fildes, R., Hibon, M., Lewandowski, R., Newton, J., Parzen, E., & Winkler, R. (1982). The accuracy of extrapolation (time series) methods: Results of a forecasting competition. Journal of Forecasting, 1(2), 111–153. doi:10.1002/for.3980010202 Used by: D18
- Makridakis and Hibon (2000) Makridakis, S., & Hibon, M. (2000). The M3-Competition: results, conclusions and implications. International Journal of Forecasting, 16(4), 451–476. doi:10.1016/S0169-2070(00)00057-1 Used by: D19
- Athanasopoulos et al. (2011) Athanasopoulos, G., Hyndman, R. J., Song, H., & Wu, D. C. (2011). The tourism forecasting competition. International Journal of Forecasting, 27(3), 822–844. doi:10.1016/j.ijforecast.2010.04.009 Used by: D20
- Makridakis et al. (2020) Makridakis, S., Spiliotis, E., & Assimakopoulos, V. (2020). The M4 Competition: 100,000 time series and 61 forecasting methods. International Journal of Forecasting, 36(1), 54–74. doi:10.1016/j.ijforecast.2019.04.014 Used by: D6, D9
- Chatfield (1993) Chatfield, C. (1993). Calculating Interval Forecasts. Journal of Business & Economic Statistics, 11(2), 121–135. doi:10.1080/07350015.1993.10509938 Used by: Context
- Svetunkov (2023) Svetunkov, I. (2023). Forecasting and Analytics with the Augmented Dynamic Adaptive Model (ADAM). Chapman and Hall/CRC. doi:10.1201/9781003452652 Used by: Context, D1, D8, D10, D11, D15
Artefacts
- A1 · manuscript Written record of the investigation up to plan PL13 (questions Q1 to Q5), each number taken from a recorded run.
- A2 · code Notebook reproducing the tables of the written record from the recorded run outputs.
- A3 · figure · data_plot Calibration curves of the 99 quantiles in the known-model simulation, cases T, E and S, at T = 15, 25, 50, 100, 300: coverage of each quantile (top) and coverage minus level (bottom).
- A4 · figure · data_plot Calibration curves of the 99 quantiles of AutoMSARIMA 1.0.8 and 1.3.0 on the benchmark (backcasting, optimal) and in the simulation at T = 100.
- A5 · figure · data_plot Calibration curves of the 99 quantiles on the 5,315 benchmark series: auto.msarima, auto.adam with error selection and the selected ETS, overall, by level tercile and by the distribution auto.adam chose.
- A6 · figure · data_plot Calibration curves of the 99 quantiles on the fresh M4 sample: auto.msarima and auto.adam with error selection, overall, by level tercile and by the distribution auto.adam chose.
- A7 · lab_record Lab record of the study (branch claimset/msarima-interval-calibration): questions, hypotheses, plans, approvals, runs, results and notes as an append-only, hash-chained event log (lab record 0.20, claimset 0.39.0).
- A8 · code Scripts of the study: simulation (q1_*), version decomposition (q2_*), benchmark analyses (q3_*), M4 (q4_m4.py), auto.adam in R and the calibration curves (q5_*).
- A9 · data Outputs of every recorded run (per-replicate and per-series coverage, pinball and selected models; no observations of the M1, M3, Tourism or M4 series).
Score
Reliability of the paper: 60, Medium
Scores are computed by rules from the claimset file (EntryLib rubric 0.2): they check the record, not the science, and may change as the rubric and reviews develop. The rubric. Every issue as text, for an agent preparing the next version.
The paper scores as its lowest principal claim, C6. Open problems in the principal claims and what they rest on, each counted once, with the most it costs a claim:
- −30 Support Rests on argument only. In C6. To remove it: Support the claim with evidence the claimset records, or have its proof checked.
- −12 Open problems Limitation L4 (could bias magnitude, not mitigated): smooth 1.0.8 ran from a separate worktree at tag v1.0.8-py with its own Python environment, so the versions also differ in the environment around the package. In C4. To remove it: Mitigate it with evidence, or narrow the claim's scope so that it no longer applies.
- −12 Open problems Limitation L6 (could bias magnitude, not mitigated): The thresholds of plan PL15 were fixed after the exploratory benchmark run of auto.adam (RN45) was seen, on M4 series that run did not use. In C5. To remove it: Mitigate it with evidence, or narrow the claim's scope so that it no longer applies.
- −5 Context A principal claim related to no earlier work. In C3, C4, C5, C6. To remove it: Relate the claim to the earlier work it extends, addresses or departs from.
- −5 Plan The lab record flags the test: code changed after plan. In C2, C3, C4. To remove it: Rerun the test as planned, or explain the flag in a limitation.
- −3 Plan The plan's time is anchored by a git push only. In C1, C2, C3, C4, C5, C7. To remove it: Anchor plans with the platform, a timestamp authority (RFC 3161) or a registry.
- −3 Open problems Assumption C24 is not checked: The coverage of a set of series is well summarised by first averaging the holdout observations within each series and then averaging over series, all horizons together. In C1. To remove it: Test the assumption, or analyse how sensitive the claim is to it.
- −5 Open problems Limitation L2 (reduces precision, not mitigated): The lab record flags plans PL11, PL12 and PL13 with code changed after the plan; the only commit between those plans and their runs updated the claimset skills under .claude/skills, not the analysis scripts. In C2, C3, C4. To remove it: Mitigate it with evidence, or narrow the claim's scope so that it no longer applies.
- −1 Open problems Limitation L3 (reduces transferability, not mitigated): ETS(MNN), the comparator whose coverage stays flat over the level terciles on M4, is badly centred there (q50 of 0.372) and has an MCE of 0.0849, so its flat cov80 does not make it well calibrated. In C2. To remove it: Mitigate it with evidence, or narrow the claim's scope so that it no longer applies.
- −2 Open problems Limitation L5 (reduces transferability, not mitigated): The auto.adam comparison ran in R, because Python's AutoADAM removes dlnorm from the candidate distributions of a pure ARIMA whatever the user passes, while R's auto.adam removes it only from its default list. In C5. To remove it: Mitigate it with evidence, or narrow the claim's scope so that it no longer applies.
- −5 Open problems Limitation L7 (reduces precision, not mitigated): The series where the selected ETS(ANN) and ARIMA(0,1,1) give the same forecast and width are 114 of 5,315. In C10. To remove it: Mitigate it with evidence, or narrow the claim's scope so that it no longer applies.
- −3 Open problems Assumption C25 is not checked: The ratio of the mean of the last third of a series to its overall mean indexes how much the scale of its errors at the forecast origin exceeds the average scale over the sample. In C2, C8. To remove it: Test the assumption, or analyse how sensitive the claim is to it.
Claims
C1: 94, High
Novelty: new, by the authors · no close match on EntryLib
- −3 Plan The plan's time is anchored by a git push only. To remove it: Anchor plans with the platform, a timestamp authority (RFC 3161) or a registry.
- −3 Open problems Assumption C24 is not checked: The coverage of a set of series is well summarised by first averaging the holdout observations within each series and then averaging over series, all horizons together. To remove it: Test the assumption, or analyse how sensitive the claim is to it.
C2: 83, High
Novelty: new, by the authors · no close match on EntryLib
- −5 Plan The lab record flags the test: code changed after plan. To remove it: Rerun the test as planned, or explain the flag in a limitation.
- −5 Open problems Limitation L2 (reduces precision, not mitigated): The lab record flags plans PL11, PL12 and PL13 with code changed after the plan; the only commit between those plans and their runs updated the claimset skills under .claude/skills, not the analysis scripts. To remove it: Mitigate it with evidence, or narrow the claim's scope so that it no longer applies.
- −3 Open problems Assumption C25 is not checked: The ratio of the mean of the last third of a series to its overall mean indexes how much the scale of its errors at the forecast origin exceeds the average scale over the sample. To remove it: Test the assumption, or analyse how sensitive the claim is to it.
- −3 Plan The plan's time is anchored by a git push only. To remove it: Anchor plans with the platform, a timestamp authority (RFC 3161) or a registry.
- −1 Open problems Limitation L3 (reduces transferability, not mitigated): ETS(MNN), the comparator whose coverage stays flat over the level terciles on M4, is badly centred there (q50 of 0.372) and has an MCE of 0.0849, so its flat cov80 does not make it well calibrated. To remove it: Mitigate it with evidence, or narrow the claim's scope so that it no longer applies.
C3: 78, Medium
Novelty: new, by the authors · no close match on EntryLib
- −5 Context A principal claim related to no earlier work. To remove it: Relate the claim to the earlier work it extends, addresses or departs from.
- −5 Plan The lab record flags the test: code changed after plan. To remove it: Rerun the test as planned, or explain the flag in a limitation.
- −5 Open problems Limitation L2 (reduces precision, not mitigated): The lab record flags plans PL11, PL12 and PL13 with code changed after the plan; the only commit between those plans and their runs updated the claimset skills under .claude/skills, not the analysis scripts. To remove it: Mitigate it with evidence, or narrow the claim's scope so that it no longer applies.
- −3 Open problems Assumption C25 is not checked: The ratio of the mean of the last third of a series to its overall mean indexes how much the scale of its errors at the forecast origin exceeds the average scale over the sample. To remove it: Test the assumption, or analyse how sensitive the claim is to it.
- −3 Plan The plan's time is anchored by a git push only. To remove it: Anchor plans with the platform, a timestamp authority (RFC 3161) or a registry.
- −1 Open problems Limitation L3 (reduces transferability, not mitigated): ETS(MNN), the comparator whose coverage stays flat over the level terciles on M4, is badly centred there (q50 of 0.372) and has an MCE of 0.0849, so its flat cov80 does not make it well calibrated. To remove it: Mitigate it with evidence, or narrow the claim's scope so that it no longer applies.
C4: 73, Medium
Novelty: new, by the authors · no close match on EntryLib
- −12 Open problems Limitation L4 (could bias magnitude, not mitigated): smooth 1.0.8 ran from a separate worktree at tag v1.0.8-py with its own Python environment, so the versions also differ in the environment around the package. To remove it: Mitigate it with evidence, or narrow the claim's scope so that it no longer applies.
- −5 Context A principal claim related to no earlier work. To remove it: Relate the claim to the earlier work it extends, addresses or departs from.
- −5 Plan The lab record flags the test: code changed after plan. To remove it: Rerun the test as planned, or explain the flag in a limitation.
- −3 Plan The plan's time is anchored by a git push only. To remove it: Anchor plans with the platform, a timestamp authority (RFC 3161) or a registry.
- −2 Open problems Limitation L2 (reduces precision, not mitigated): The lab record flags plans PL11, PL12 and PL13 with code changed after the plan; the only commit between those plans and their runs updated the claimset skills under .claude/skills, not the analysis scripts. To remove it: Mitigate it with evidence, or narrow the claim's scope so that it no longer applies.
C5: 79, Medium
Novelty: new, by the authors · no close match on EntryLib
- −12 Open problems Limitation L6 (could bias magnitude, not mitigated): The thresholds of plan PL15 were fixed after the exploratory benchmark run of auto.adam (RN45) was seen, on M4 series that run did not use. To remove it: Mitigate it with evidence, or narrow the claim's scope so that it no longer applies.
- −5 Context A principal claim related to no earlier work. To remove it: Relate the claim to the earlier work it extends, addresses or departs from.
- −3 Plan The plan's time is anchored by a git push only. To remove it: Anchor plans with the platform, a timestamp authority (RFC 3161) or a registry.
- −1 Open problems Limitation L5 (reduces transferability, not mitigated): The auto.adam comparison ran in R, because Python's AutoADAM removes dlnorm from the candidate distributions of a pure ARIMA whatever the user passes, while R's auto.adam removes it only from its default list. To remove it: Mitigate it with evidence, or narrow the claim's scope so that it no longer applies.
C6: 60, Medium
Novelty: new, by the authors · no close match on EntryLib
- −30 Support Rests on argument only. To remove it: Support the claim with evidence the claimset records, or have its proof checked.
- −5 Open problems Limitation L7 (reduces precision, not mitigated): The series where the selected ETS(ANN) and ARIMA(0,1,1) give the same forecast and width are 114 of 5,315. To remove it: Mitigate it with evidence, or narrow the claim's scope so that it no longer applies.
- −5 Context A principal claim related to no earlier work. To remove it: Relate the claim to the earlier work it extends, addresses or departs from.
C7: 97, High
Novelty: new, by the authors
- −3 Plan The plan's time is anchored by a git push only. To remove it: Anchor plans with the platform, a timestamp authority (RFC 3161) or a registry.
C8: 97, High
Novelty: new, by the authors
- −3 Open problems Assumption C25 is not checked: The ratio of the mean of the last third of a series to its overall mean indexes how much the scale of its errors at the forecast origin exceeds the average scale over the sample. To remove it: Test the assumption, or analyse how sensitive the claim is to it.
C10: 95, High
Novelty: new, by the authors
- −5 Open problems Limitation L7 (reduces precision, not mitigated): The series where the selected ETS(ANN) and ARIMA(0,1,1) give the same forecast and width are 114 of 5,315. To remove it: Mitigate it with evidence, or narrow the claim's scope so that it no longer applies.
C12: 100, High
Nothing lost.
C13: 97, High
Novelty: extends earlier work, by the authors
- −3 Plan The plan's time is anchored by a git push only. To remove it: Anchor plans with the platform, a timestamp authority (RFC 3161) or a registry.
C14: 97, High
Novelty: extends earlier work, by the authors
- −3 Plan The plan's time is anchored by a git push only. To remove it: Anchor plans with the platform, a timestamp authority (RFC 3161) or a registry.
C15: 97, High
Novelty: new, by the authors
- −3 Plan The plan's time is anchored by a git push only. To remove it: Anchor plans with the platform, a timestamp authority (RFC 3161) or a registry.
C16: 85, High
Novelty: new, by the authors
- −12 Open problems Limitation L1 (could bias magnitude, not mitigated): The 12 wrong models of case W were chosen by the authors, not drawn from the mistakes AutoMSARIMA makes, so the size of the coverage loss they produce depends on that choice. To remove it: Mitigate it with evidence, or narrow the claim's scope so that it no longer applies.
- −3 Plan The plan's time is anchored by a git push only. To remove it: Anchor plans with the platform, a timestamp authority (RFC 3161) or a registry.
C17: 97, High
Novelty: new, by the authors
- −3 Plan The plan's time is anchored by a git push only. To remove it: Anchor plans with the platform, a timestamp authority (RFC 3161) or a registry.
C18: 97, High
- −3 Plan The plan's time is anchored by a git push only. To remove it: Anchor plans with the platform, a timestamp authority (RFC 3161) or a registry.
C20: 98, High
Novelty: new, by the authors
- −2 Open problems Limitation L5 (reduces transferability, not mitigated): The auto.adam comparison ran in R, because Python's AutoADAM removes dlnorm from the candidate distributions of a pure ARIMA whatever the user passes, while R's auto.adam removes it only from its default list. To remove it: Mitigate it with evidence, or narrow the claim's scope so that it no longer applies.
C21: 83, High
Novelty: extends earlier work, by the authors
- −12 Open problems Limitation L8 (could bias magnitude, not mitigated): The prediction of coverage at the benchmark lengths uses Gaussian processes and interpolates the simulated coverage over log length, with lengths outside 15 to 300 at the nearest simulated size. To remove it: Mitigate it with evidence, or narrow the claim's scope so that it no longer applies.
- −5 Plan A predictive claim tested without a plan recorded beforehand; the lab record shows every run. To remove it: Test it again under a lab-record plan or a registration, or publish the lab record that shows every run.
Versions
- Version 3 · 10 November 2026 at 13:47 UTC · corrected
- Version 2 · 10 November 2026 at 12:42 UTC · corrected
- Version 1 (this page) · 10 November 2026 at 10:24 UTC · active
Every version is kept in the public registry (github.com/entrylib/registry).